Fig. 3.
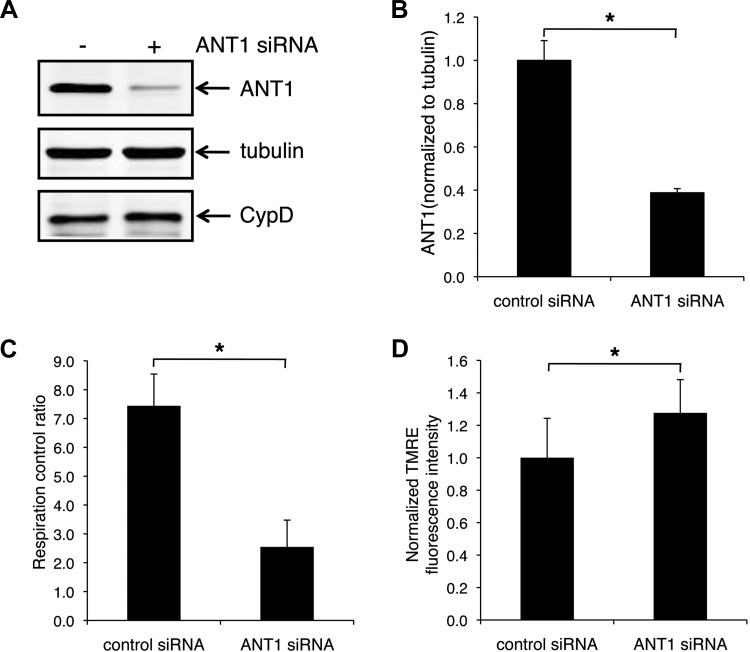
ANT1 knockdown results in a decrease in respiration control ratio and an increase in mitochondrial membrane potential in H9c2 cells. A: representative Western blot showing ANT1 knocking down by small-interfering RNA (siRNA). B: quantified results of A, expressed as the ratio to tubulin; n = 3. C: respiration control ratio in control and ANT1 knockdown cells; n = 3. D: mitochondrial membrane potential in control and ANT1 knockdown cells from 3 independent experiments. *P < 0.05 vs. control siRNA. TMRE, tetramethylrhodamine ethyl ester.

