Fig. 2.
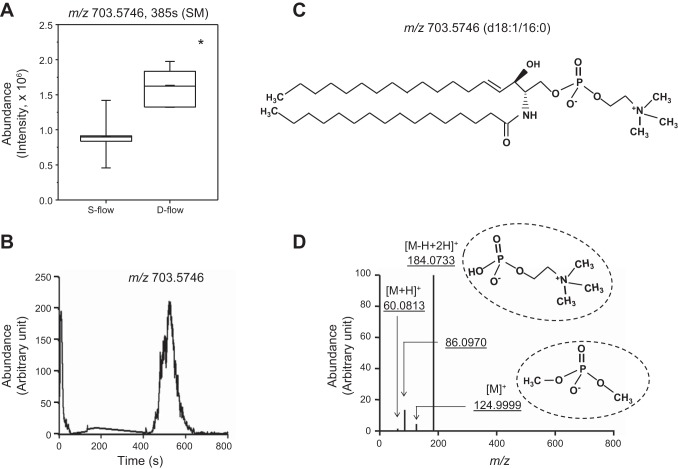
Significant increase in sphingomyelin (SM) levels in plasma by d-flow and confirmation of SM by tandem mass spectrometry. A: plasma amount of SM (m/z 703.5746, 385 s) calculated from peak intensity is shown in whisker plot comparing 8 s-flow and 7 d-flow mice. *P < 0.05. B: selected ion chromatogram for m/z window 703.5552–703.5764 (15 ppm) for MS1 full scan (85–1250). Retention time was shifted slightly due to fragmentation studies being performed under different chromatography operational parameters. C: structural formula of palmitoyl sphingomyelin SM(d18:1/16:0) D: MS/MS spectra for fragmentation of m/z 703.5746 (B) at normalized collision energy of 35%. Fragmentation pattern was consistent with MS/MS spectra for SM (d18:1/16:0) based on the Metlin fragmentation pattern for both relative abundance and accurate m/z mass. Main fragments present are the phosphocholine head group (m/z 184.0733) and subsequent fragments (m/z 124.9999, m/z 86.0970).

