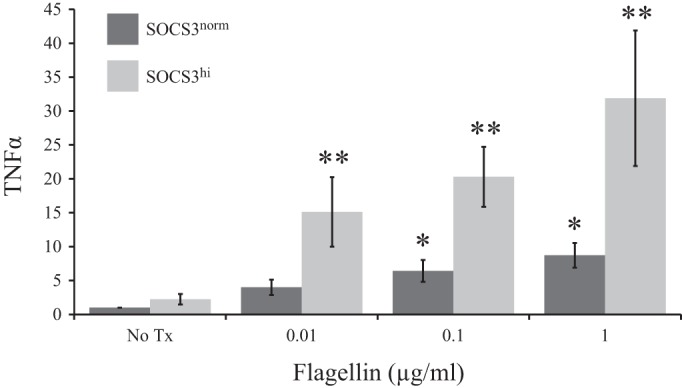
Fig. 2.

SOCS3 overexpression enhanced flagellin-induced TNF-α mRNA in a dose-dependent manner. Bar chart depicts fold increase in TNF-α mRNA, in Control (SOCS3norm) and SOCS3 overexpressing (SOCS3hi) intestinal epithelial cells (IEC) relative to no-treatment (No Tx) SOCS3norm, following 2-h flagellin treatment. *P ≤ 0.05 vs. No Tx; **P ≤ 0.05 SOCS3norm vs. SOCS3hi.
