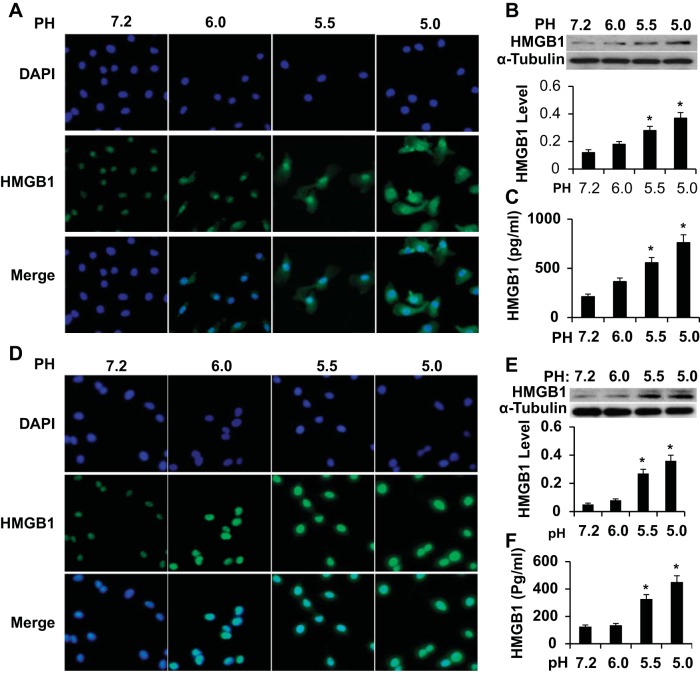
Fig. 6.
HMGB1 expression and release in cultured macrophage and human proximal tubule cells (HPTCs). A and D: HMGB1 expression and translocation from the nuclei to cytoplasm induced by acidified medium in macrophages (A) and HPTCs (D) as shown by immunostaining. DAPI, 4′,6-diamidino-2-phenylindole. B and E: Western blot analysis of HMGB1 expression in macrophages (B) and HPTCs (E) treated with acidified medium. HMGB1 levels were normalized to α-tubulin in each corresponding group. C and F: HMGB1 secretion to the supernatant of cultured macrophages (C) and HPTCs (F) as measured by ELISA. n = 3. *P < 0.01 compared with the physiological pH environment (pH 7.2) in each group.

