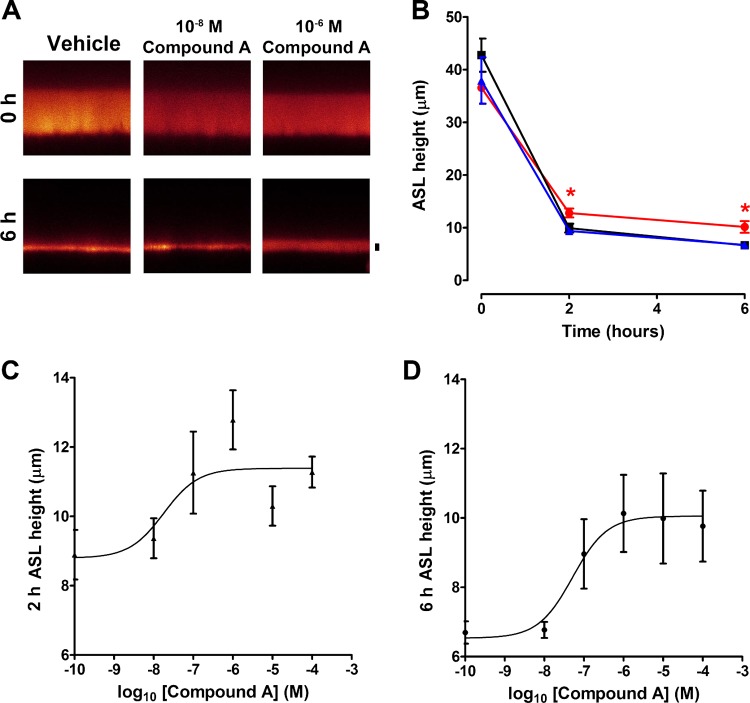
Fig. 3.
Compound A reduces ASL absorption under thin film conditions in HBEC cultures. A: typical XZ confocal micrographs of ASL height (red) before (0 h) and 6 h after exposure to Compound A or vehicle (control; PBS). Scale bar = 7 μm. B: mean ASL height over time in normal HBECs without (■), or with 10−8 M (▲) and 10−6 M (●) Compound A. All n = 6–11. C and D: dose responses for Compound A vs. ASL height taken 2 and 6 h after Compound A exposure, respectively. All n = 6–11. Data shown as means ± SE. *P < 0.05 different ± Compound A.

