Fig. 8.
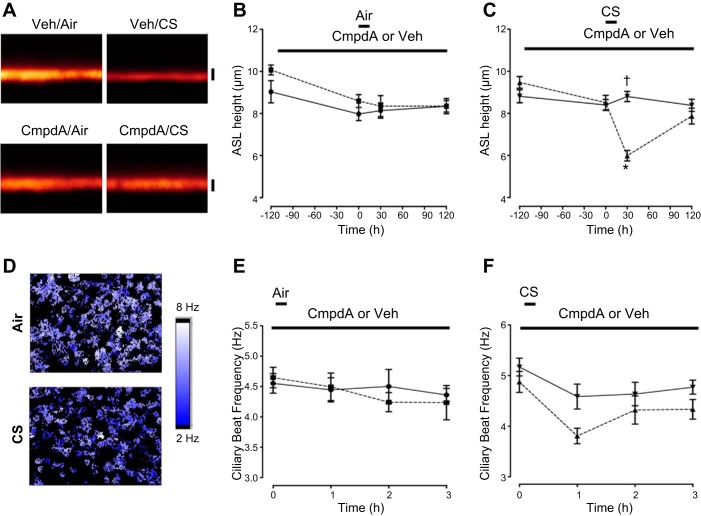
Compound A prevents cigarette smoke (CS)-induced ASL volume depletion. A: typical XZ confocal micrographs of ASL height (red) in the presence of either Compound A or vehicle (PBS) and following exposure to air (control) or 10 puffs of CS as indicated. Scale bar = 7 μm. B and C: mean ASL height over time when cultures were dosed with 1 μM Compound A or vehicle for 2 h followed by air or CS, respectively. All n = 9–12. Importantly, baseline ASL was set to ∼7 μm to induce a comparative situation between the 2 groups. D: heat maps of ciliary beat frequency (CBF) following air (control) or CS exposure in HBECs measured using the Sisson-Ammons Video Analysis system. E: mean CBF measured immediately before (0) or up to 3 h after exposure to air in the presence of vehicle or Compound A (1 μM). All n = 6. F: mean CBF measured immediately before (0) or up to 3 h after CS exposure with vehicle or Compound A (1 μM). ■, air/vehicle; ●, air/Compound A; ▲, CS/vehicle; ▼, CS/Compound A. Data shown as means ± SE. *P < 0.05 different ± air or CS; †P < 0.05 different ± Compound A.

