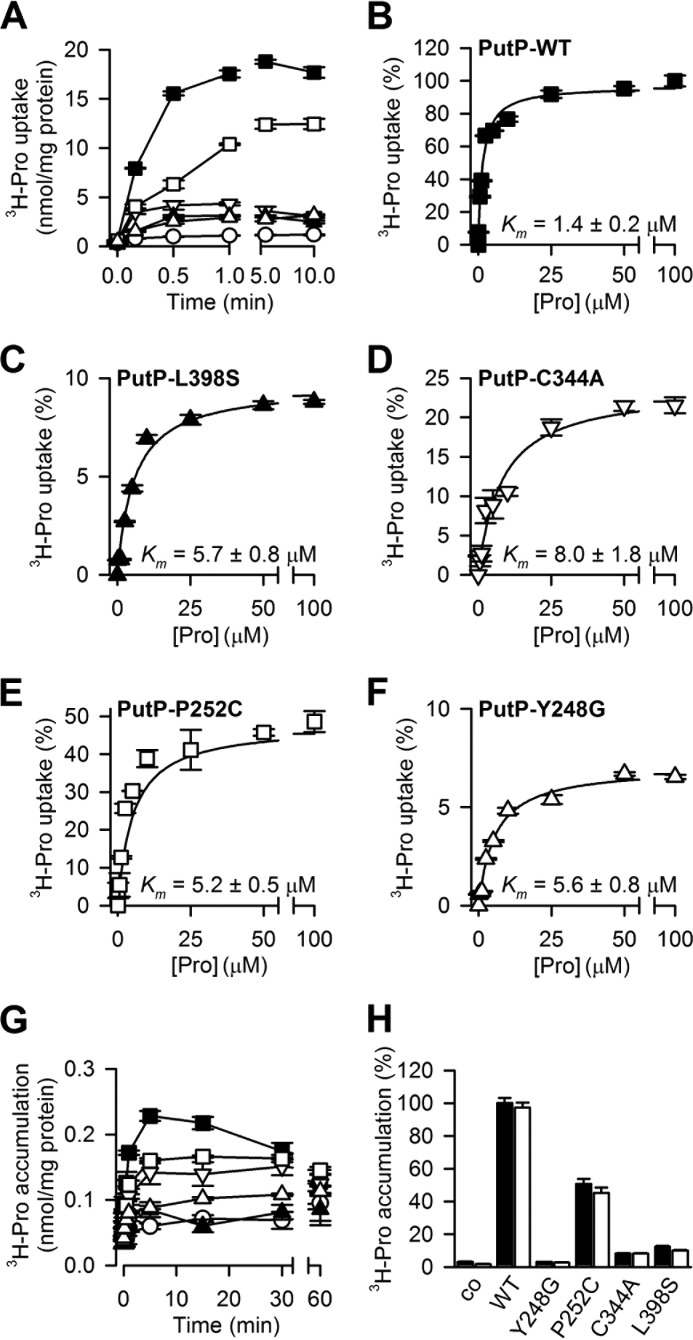
FIGURE 8.
PutP-mediated transport. A, time course of 2 μm [3H]proline (1 Ci/mmol) uptake by E. coli WG170 harboring PutP-WT (■), PutP-C344A (∇), PutP-L398S (▴), PutP-Y248G (Δ), and PutP-P252C (□) or a control plasmid (○) in the presence of 10 mm NaCl. B–F, kinetics of Na+-coupled proline transport. Initial rates of transport were determined at [3H]proline concentrations ranging between 0.1 and 100 μm for 10 s (PutP-WT and PutP-P252C) or 30 s (PutP-Y248G, PutP-C344A, or PutP-L398S). Data were normalized to the activity of PutP-WT tested in parallel to account for the batch-specific variations in the expression levels and fit to the Michaelis-Menten equation. Data are shown as mean ± S.E. of triplicate determinations of a representative experiment, and kinetic constants represent the mean ± the S.E. of the fit. The Km values are listed in the corresponding graphs. B, PutP-WT; C, PutP-L398S; D, PutP-C344A; E, PutP-P252C; F, PutP-Y248G. G, time course of proline counterflow. Concentrated cell suspensions of WG170 producing the indicated PutP variant or nontransformed control cells were pre-loaded with 1 mm Pro for 2 h prior to a rapid 200-fold dilution into buffer containing 1 μm [3H]Pro. H, facilitated diffusion of 20 μm [3H]proline by WG170 harboring the indicated PutP variants after treatment of the cells with 5 μm CCCP and 5 μm monensin. Transport was assayed in the presence (solid bar) or absence (open bar) of 10 mm NaCl, and data were normalized with regard to the initial rate of the proline accumulation measured after 10 s for PutP-WT in the presence of NaCl (7.6 ± 0.2 nmol × mg−1 × min−1). Data are normalized with regard to the 1-min uptake activity observed in PutP-WT.

