
FIGURE 5.
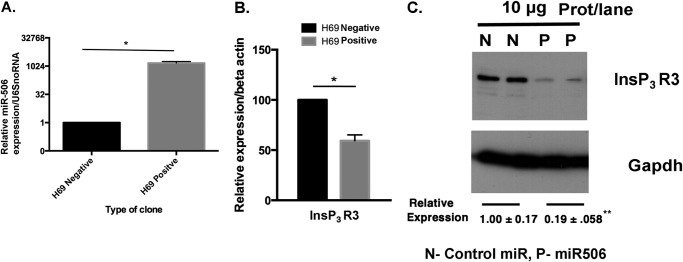
H69 cells stably expressing miR-506 show elevated miR-506 expression (A) and exhibit markedly decreased InsP3R3 mRNA (B) and protein (C) levels. H69 normal cholangiocyte cells stably expressing a negative control miR or miR-506 were generated as described under “Experimental Procedures.” A, mature miR-506 levels in H69-miR-506 cells and control-miR cells were analyzed by TaqMan qPCR and normalized to U6 snoRNA. B, InsP3R3 mRNA levels were analyzed in both cell types by qPCR using TaqMan assay and expressed relative to negative controls after normalization to β-actin. C, InsP3R3 protein levels were examined from protein extracts of negative control-miR and miR-506 H69 at two different passages (two N and P lanes). Gapdh protein levels were used as loading controls. The two lanes for the N (control-miR) and P (H69 miR-506 cells) correspond to passage numbers 9, 15 and 6, 10, respectively. Rel.Exp, relative expression compared with control-miR.