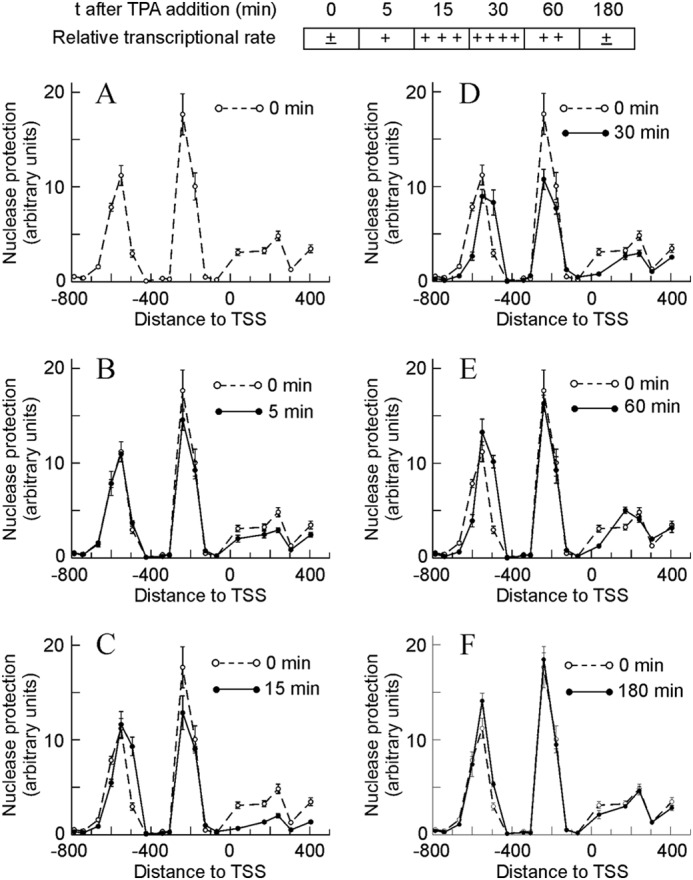
FIGURE 1.

Time-dependent changes in micrococcal nuclease protection in the promoter and proximal coding region of the Egr1 gene during TPA induction. To facilitate the interpretation of the results, a semiquantitative diagram showing the relative transcriptional rate is included at the top. The protection against nuclease digestion at different times after adding TPA, as shown in A–F, was determined and plotted against the distance to TSS. For comparison purposes, the nuclease protection at t = 0 min was shown in all the panels. The plotted experimental points correspond to the means ± S.E. of three determinations.
