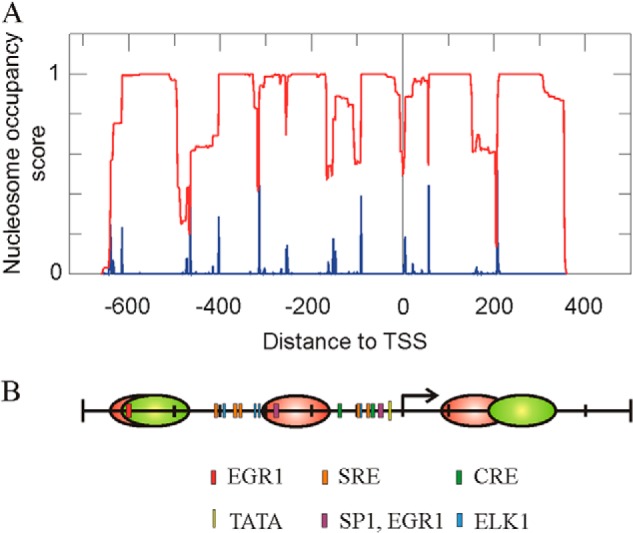
FIGURE 2.

Nucleosome occupancy at the promoter and proximal coding region of the Egr1 gene. A, prediction of the nucleosome occupancy score (red) and of the probability of starting nucleosomes (blue), as determined by the NuPoP program (32). B, map of the Egr1 region under study, showing the location of cis elements and the experimental positions of the nucleosomes in noninduced MLP29 cells (red). The proposed position of nucleosomes −2 and +1 30 min after TPA addition is also shown (green). The proposed positions of nucleosomes are based on the experiments of Figs. 1 and 4.
