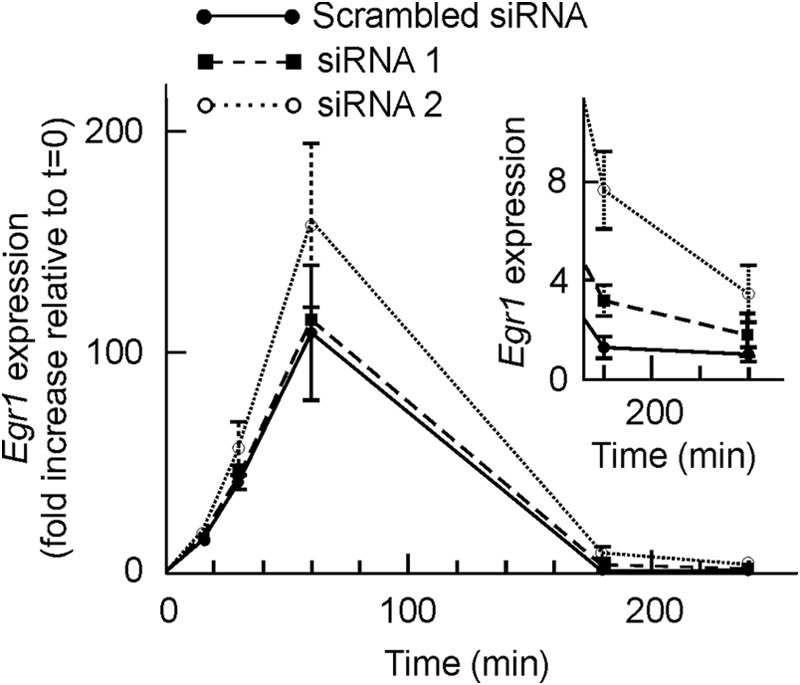
FIGURE 6.

Effects of Egr1 knockdown on the expression of the gene. MLP29 cells were treated with scrambled siRNA, with siEgr1 1, or with siEgr1 2, and the Egr1 expression was determined by quantitative RT-PCR and plotted, as a function of time after induction with TPA, as fold increase relative to t = 0. The inset shows a magnification of the figure for the two longer times. Points correspond to the means ± S.E. of three determinations.
