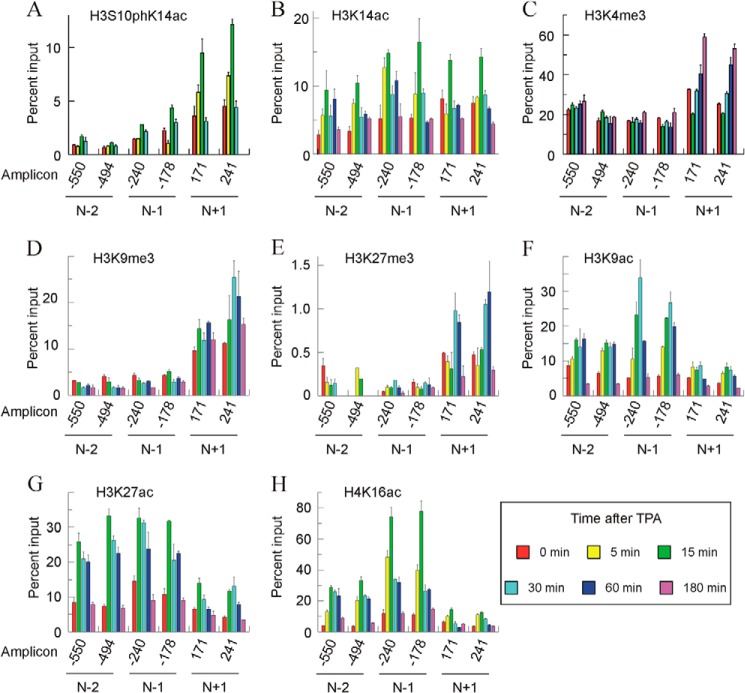
FIGURE 8.
Time course of histone modifications in nucleosomes −2, −1, and +1 after adding TPA to MLP29 cells. A–H show the levels of different modifications in a representative experiment, plotted as percent of input, for two amplicons in every nucleosome. Error bars represent the standard deviation of three determinations. The times after adding TPA are given in the inset at bottom right.

