
FIGURE 9.
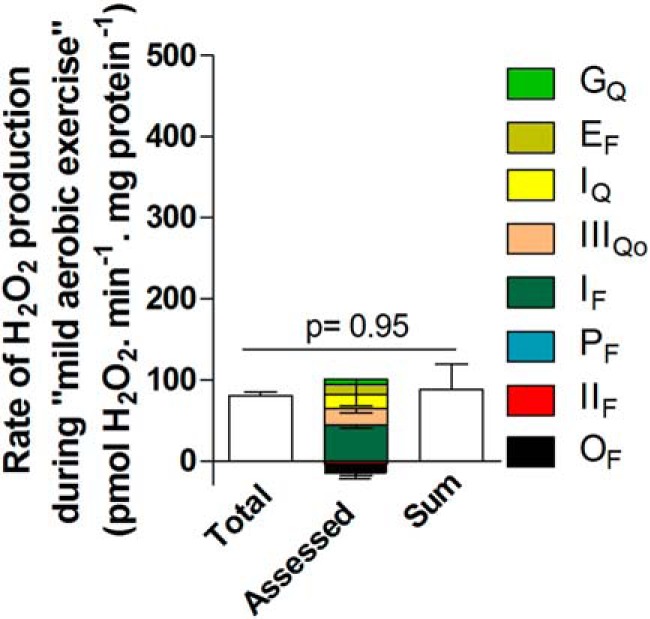
Contributions of different sites during “mild aerobic exercise.” Mitochondria were incubated in medium mimicking mild aerobic exercise (Table 1). The total rate of H2O2 production (from Fig. 2D) and the contributions of sites IF, IIIQo, IQ, EF, GQ, PF, IIF, and OF were assessed in the same way as for “rest” in Fig. 8 using the calibration curves in Figs. 5C and 6C. Inverted error bars indicate the propagated errors for each site. Values are means ± S.E. (error bars) (n = 3–9). Because some of the assessed contributions were negative, the sum of the contributions by each site was also plotted (error bar indicates the propagated sum of the errors for each assessed site) and used for the statistical test. Welch's t test was used to determine p = 0.95.