
TABLE 3.
Corrections applied for changes in redox state of NAD(P)H and cytochrome b566, and rate of superoxide/H2O2 production from each site during “rest,” “mild aerobic exercise,” and “intense aerobic exercise”
Δ control values in columns B and C were used to correct the observed changes in H2O2 production rate in column A for changes in the redox states of NAD(P)H and cytochrome b566, as shown in the last column.
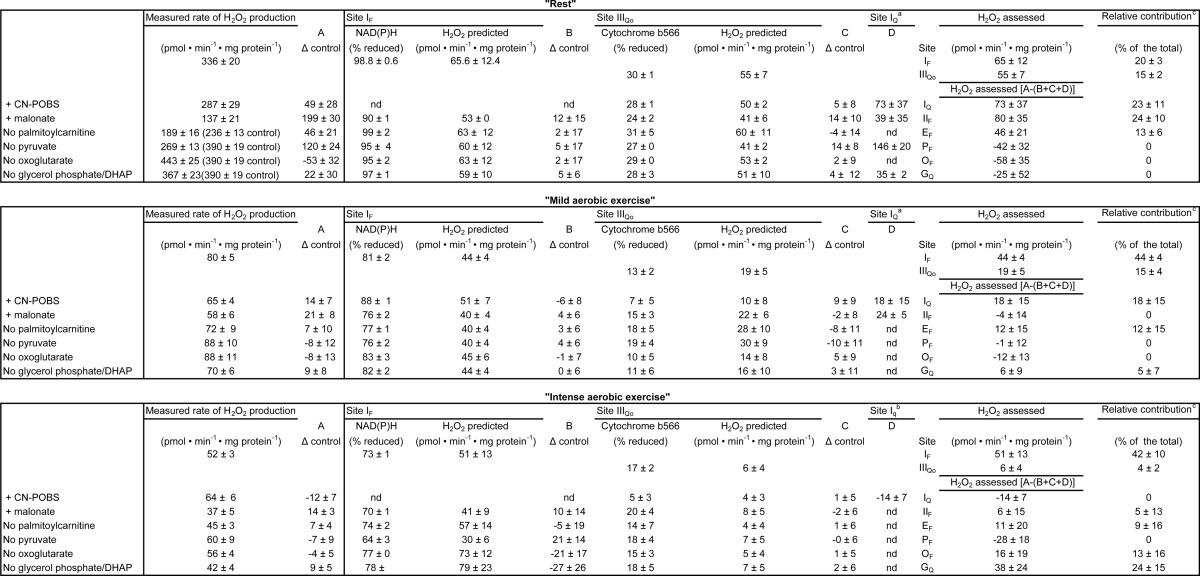
a 2.5 μm CN-POBS decreased IQ superoxide production by only 65%; therefore, values were scaled to account for CN-POBS potency.
b 10 μm CN-POBS reduced IQ superoxide production by only 75%; therefore, values were corrected for CN-POBS potency.
c The relative contribution was calculated based on the CDNB corrected rates for each site. The S.E. was scaled according to the internal error for each site. DHAP, dihydroxyacetone phosphate; nd, not determined.