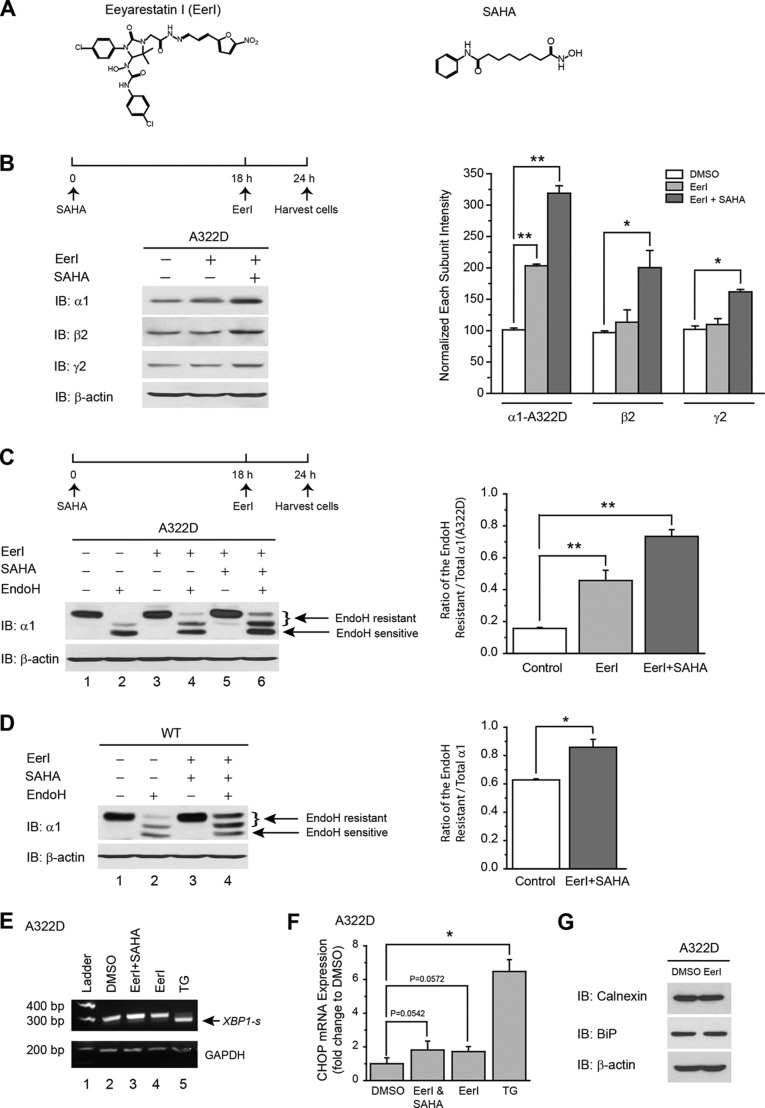
FIGURE 3.
Inhibiting VCP increases the total protein level and trafficking of the α1(A322D) subunit in HEK293 cells, and coapplication of SAHA enhances this effect without an induction of the Unfolded protein response. A, chemical structures of EerI (left panel) and SAHA (right panel). B, effect of EerI and SAHA on the total protein levels of the α1(A322D), β2, and γ2 subunits in HEK293 cells stably expressing α1(A322D)β2γ2 GABAA receptors. EerI (5 μm) was added to the cell culture medium for the last 6 h, and SAHA (2.5 μm) was added for 24 h before cell lysis and Western blot analysis (n = 3). The dosage regimen is shown at the top. The intensity of the α1(A322D), β2, or γ2 subunits was quantified, normalized to that of dimethyl sulfoxide (DMSO) vehicle control, and is shown in the right panel. IB, immunoblot. C and D, effect of EerI and SAHA on endo H-resistant α1 subunits in HEK293 cells expressing α1(A322D)β2γ2 (C) and WT α1β2γ2 receptors (D) (n = 3). The dosage regimen is the same as that in B. The curly brackets indicate the top endo H-resistant bands in lanes 2, 4, and 6 (C) and in lanes 2 and 4 (D). Quantification of the ratio of endo H-resistant/total α1 subunit bands is shown in the right panels. NT, non-targeting; Ctl, no enzyme digestion control; Eh, endo H. E, effect of EerI and SAHA on XBP1 splicing using RT-PCR analysis. HEK293 cells stably expressing α1(A322D)β2γ2 receptors were incubated with EerI (5 μm, 6 h) in the absence or presence of SAHA (2.5 μm, 24 h) prior to RNA extraction and RT-PCR analysis (n = 2). Unspliced XBP1 yielded a 289-bp amplicon, whereas spliced XBP1-s yielded a 263-bp amplicon. Thapsigargin (TG, 1 μm, 6 h) was used as a positive control to induce XBP1 splicing (lane 5, bottom band). GAPDH was used as a loading control. F, effect of EerI and SAHA on CHOP mRNA levels using quantitative RT-PCR analysis. After chemical compound incubations as in E, HEK293 cells were subjected to mRNA extraction and quantitative RT-PCR analysis. The experiments were done three times with triplicates each time. Thapsigargin (1 μm, 6 h) was used as a positive control to induce CHOP expression. G, EerI treatment (5 μm, 6 h) does not alter the protein levels of major chaperones in the ER in HEK293 cells stably expressing α1(A322D)β2γ2 GABAA receptors (n = 2). Each data point in B–D and F is reported as mean ± S.E. *, p < 0.05; **, p < 0.01.

