
FIGURE 7.
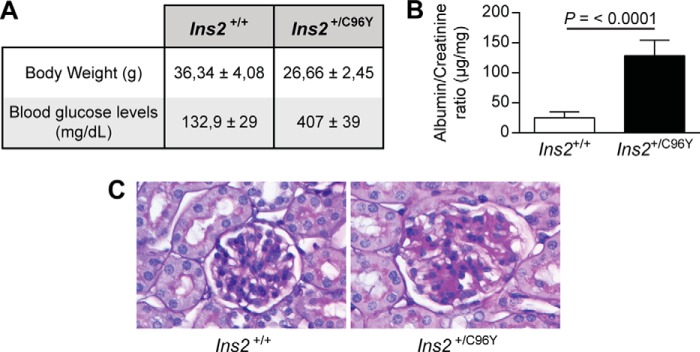
Blood glucose, renal function, and pathology. Shown are body weight and fasting blood glucose levels (A), urine albumin/creatinine ratio (B), and renal glomeruli stained with periodic acid Schiff for renal pathology (C) of Ins2+/+ and Ins2+/C96Y mice. Results are shown as mean ± S.D. of five animals.