FIGURE 1.
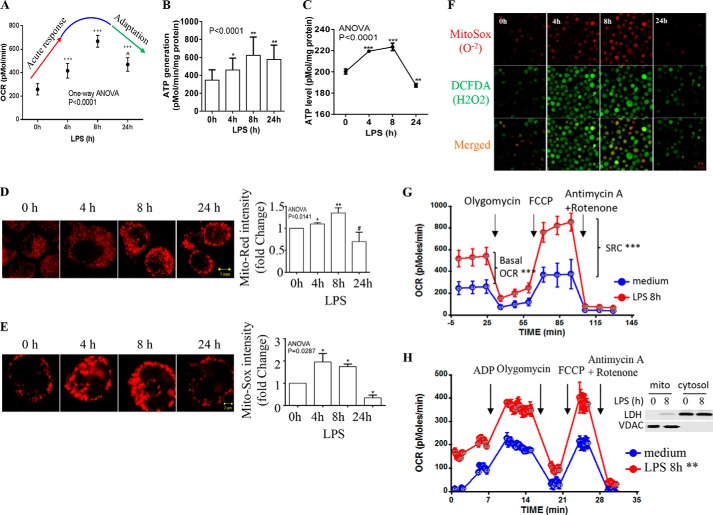
Biphasic shifts in mitochondrial bioenergetics accompany inflammation adaptation. THP-1 cells were stimulated with 1 μg/ml of LPS for the indicated times, spanning the phenotype shift from acute initiation (0–8 h) to postacute adaptation (8–24 h). A, acute inflammatory response-induced dynamic changes in mitochondrial OCR analyzed using a Cell Mito Stress kit. B, ATP generation calculated by subtracting OCR after oligomycin treatment from basal OCR. C, kinetics of mitochondrial ATP generation evaluated by the biochemical assay in vitro. D, modifications in mitochondrial membrane potential analyzed by confocal microscopy (left panel) and flow cytometry (right panel; data normalized on 0 h) using MitoTracker Red dye. E, mitochondrial superoxide production assessed by confocal microscopy (left panel) and flow cytometry (right panel; data normalized on 0 h) using Mito-Sox Red dye. F, fluorescence microscopy study of the production of mitochondrial superoxide and cellular hydrogen peroxide stained by dichlorofluorescein diacetate. G, mitochondrial SRC identified by differences between the basal and maximal OCR (8 h after LPS) after adding ETC-uncoupler FCCP. H, dynamic changes in ETC respiration in purified mitochondria over the course of TRL4 response. Mitochondria were isolated from THP-1 cells treated with or without LPS for 8 h. Bioenergetics was analyzed in an equal amount (10 μg) of mitochondrial protein as described under “Experimental Procedures.” The inset shows purity of mitochondrial preparations. The data in A, B, C, G, and H are mean ± S.E. of quadruplicate wells from one of three separate experiments. The flow cytometry data in C and D are mean ± S.E. from three independent experiments. The one-way ANOVA p value in A–E depicts the significance across time points; subsequent unpaired t tests determined the significance between 0 h and other time points. The AUC in F and G is analyzed by XF software. *, p < 0.05; **, p < 0.01; ***, p < 0.001; #, p > 0.05; ∧ indicates p > 0.05 in comparison to OCR at 4 h after LPS.

