
FIGURE 3.
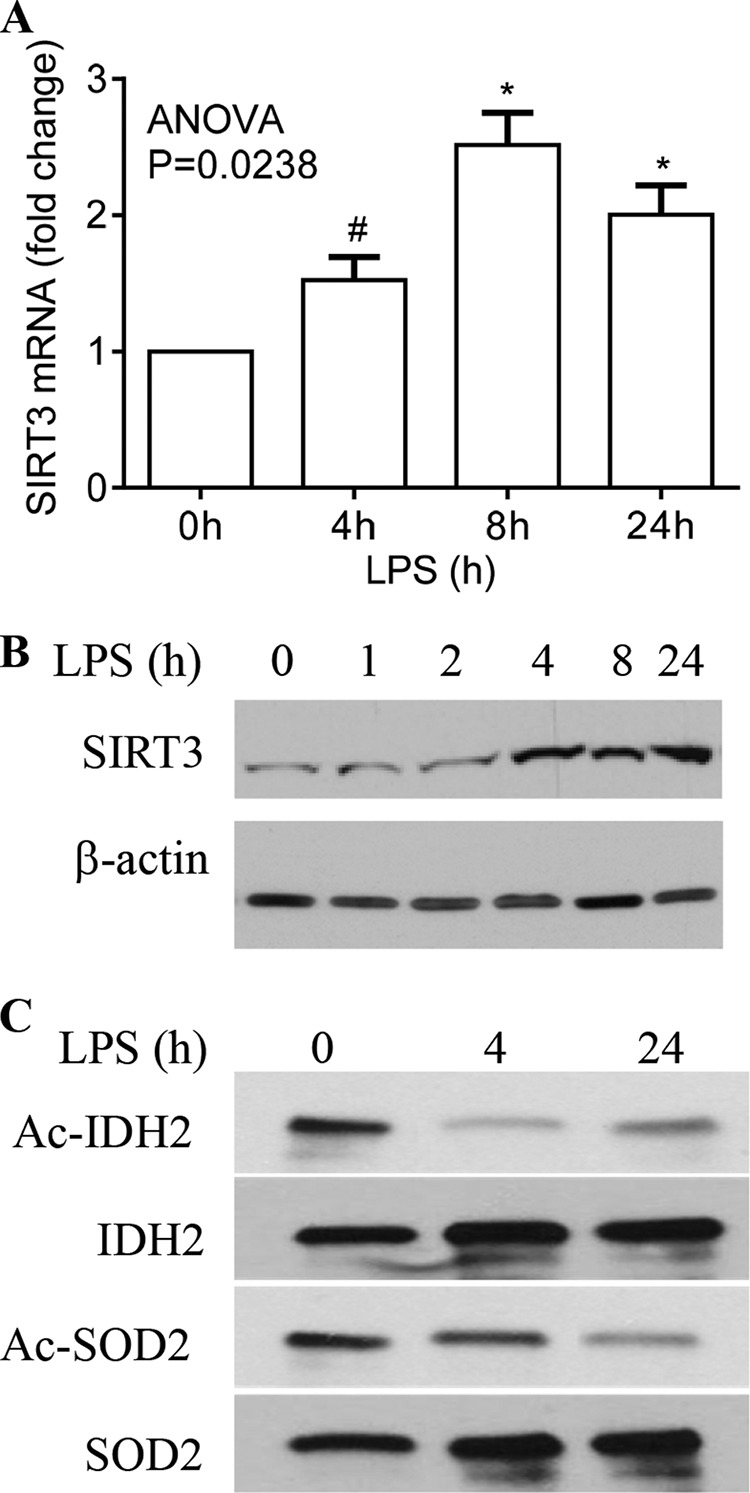
SIRT3 expression and activation increased with inflammation adaptation. THP-1 cells were stimulated with or without 1 μg/ml of LPS for the indicated times. A, LPS-induced SIRT3 gene transcription. B, LPS-induced changes in SIRT3 protein were analyzed by Western blot. C, deacetylation activation of representative mitochondrial rate-limiting enzymes followed at baseline, 4, and 24 h post-LPS using anti-acetyl lysine antibody developed by rabbit IgG trueblot. Total cellular IDH2 and SOD2 were co-immunoprecipitated with anti-IDH2 or anti-SOD2 antibodies. Data in A are shown as mean ± S.E. of five experiments. One of five experiments is shown in B, and one of three experiments is shown in C. The one-way ANOVA p value in A determines the significant changes in SIRT3 mRNA across time points. The significant changes in SIRT3 mRNA between 0 h and other time points were analyzed by subsequent unpaired t tests, *, p < 0.05; #, p > 0.05.