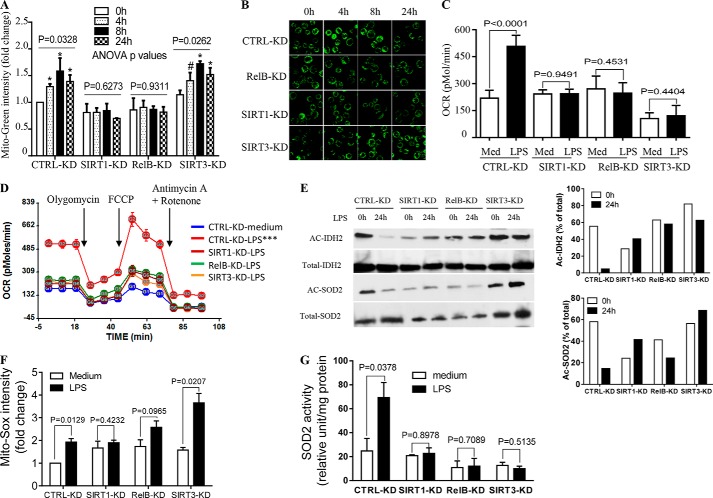
FIGURE 4.
SIRT1, RELB, and SIRT3 regulate mitochondrial bioenergetics. To test distinct functions, SIRT1, RELB, or SIRT3 genes were stably silenced in THP-1 cells by infecting the cells with control or gene-specific lentiviral shRNA. Cells were then stimulated with 1 μg/ml of LPS for the indicated times. A, changes in mitochondrial mass defined by mean fluorescence intensity of MitoTracker Green dye at 0, 4, 8, and 24 h. B, fluorescence microscopy study of mitochondrial mass stained by MitoTracker Green. C, OCR changes in control versus gene-specific shRNA cells assessed at 0 and 24 h. D, gene silencing effects on bioenergetics as determined by XF-24 Extracellular Flux Analyzer. E, acetylated IDH2 and SOD2 were determined using anti-acetylated lysine antibody at 0 and 24 h (left panel) and densitometry assay of Ac-IDH2 and Ac-SOD2 normalized against total immunoprecipitated proteins (right panel). F, mitochondrial superoxide O2⨪ production determined by flow cytometry using Mito-Sox dye. G, SOD2 activity assessed biochemically in vitro. Data in A are shown as mean ± S.E. (n = 3). Data in C, D, F, and G are mean ± S.E. of triplicate wells (representative of n = 3). A representative experiment of two is shown in B and E. One-way ANOVA p values in A determined the significance across the time points for each RNAi; results of unpaired t tests are shown in C, F, and G. AUCs between medium and LPS treatments in D are analyzed by XF software. *, p < 0.05; ***, p < 0.001; #, p > 0.05. CTRL: control.

