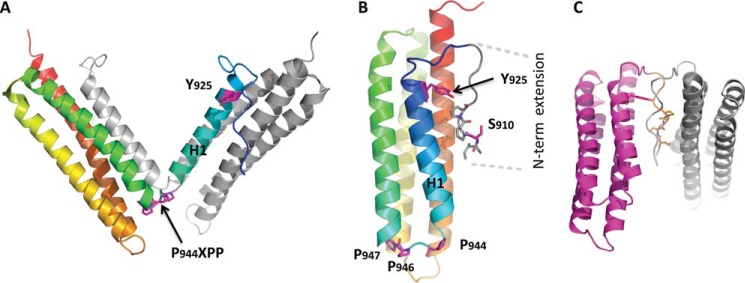
FIGURE 2.

Structural analysis of FAT predicts several possible modes of dimerization. A, crystallographic model for the H1-swapped FAT dimer (PDB accession 1K04). One protomer is shown in gray; the other one is color-ramped from the N terminus (blue) to the C terminus (red). B, interaction in cis between the N-terminal extension (residues 908–915) and FAT H1/H4 observed in the FAT(892–1052) crystal structure determined to a resolution of 2.6 Å for this study (Table 1, PDB accession 3S9O, molecule A is shown). The secondary structure representation is color-ramped as in A. Side chains of relevant residues are shown. C, crystallographic model for a potential FAT-FAT interaction via swapping of the N-terminal extensions (residues 908–915). This arrangement is also taken from PDB accession 3S9O, molecule C, and symmetry-related molecule C.
