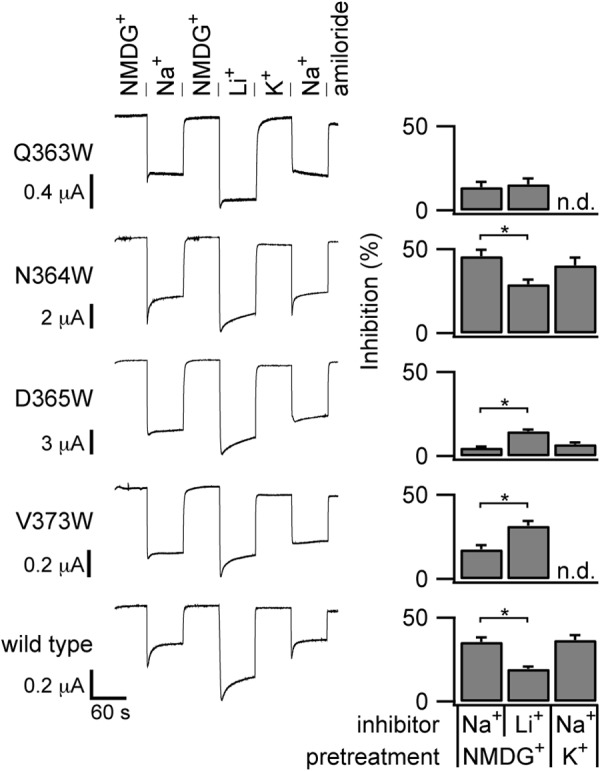
FIGURE 4.

Cation specificity of the inhibitory response measured with a constant voltage clamp. ENaC-expressing oocytes were voltage-clamped at −100 mV during current measurements. Perfusates with 100 mm of the indicated cation were switched every 60 s. Amiloride was added to the Na+ solution at the end of each experiment. Inhibition upon Na+ or Li+ addition was calculated as in Fig. 1E. Quantified results are from 18 wild-type experiments and six to nine experiments for each mutant. *, p < 0.05 by paired Student's t test. n.d., not determined.
