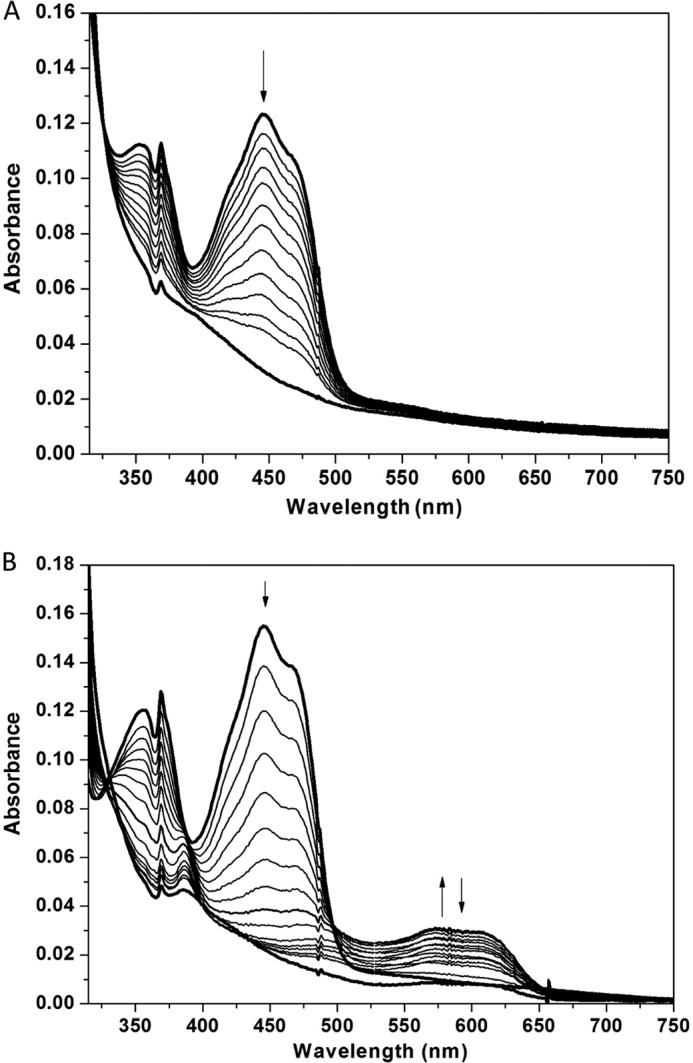
FIGURE 5.

Anaerobic reduction of FMN bound to hIYD by xanthine and xanthine oxidase as monitored with absorbance spectroscopy. Sample spectra during reduction indicate that the absorbance at 446 nm decreases during reduction as indicated by the arrow in the absence (A) and presence (B) of F-Tyr. Only in the presence of F-Tyr does a spectral intermediate with a λmax of 590 nm increase and then decrease during reduction.
