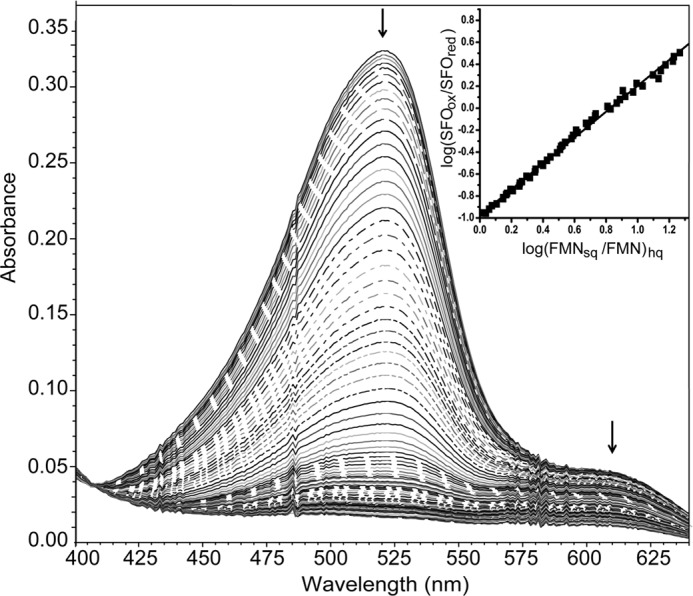
FIGURE 8.

Reduction of FMNsq to FMNhq when bound to hIYD in the presence of F-Tyr. A selected number of spectra are illustrated for clarity, and the arrows indicate the direction of the absorbance change. The reduction of FMNsq and Safranine O by xanthine and xanthine oxidase was monitored at 610 and 520 nm, respectively. Inset, the linear best fit of log(FMNsq/FMNhq) versus log(SFOox/SFOred) was used to calculate the midpoint potential (24, 25).
