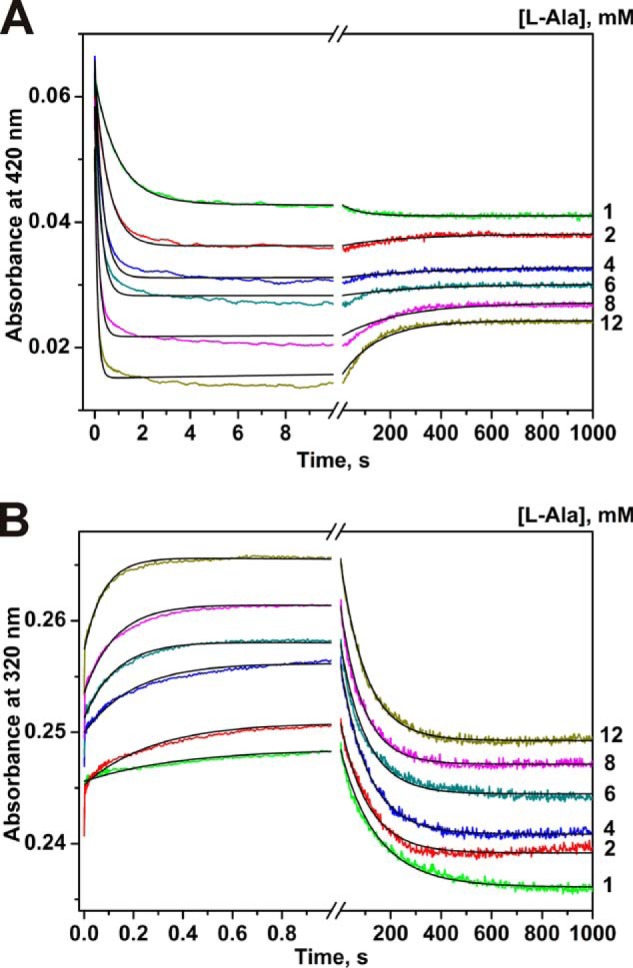
FIGURE 3.

Interaction of MGL and l-alanine as monitored by changes of absorbance of the holoenzyme. Time courses were recorded at pH 7.8, 0.1 m potassium phosphate buffer solution, containing 0.5 mm DTT and 0.1 mm EDTA, with the concentration of MGL fixed at 12.5 μm, T = 25 °C. Solution of enzyme was mixed with various concentrations of l-alanine (1.0–12.0 mm). Each kinetic curve was averaged over at least four independent experiments. The absorbance at 420 nm (A) and 320 nm (B) was detected. Solid lines represent the fitted curves.
