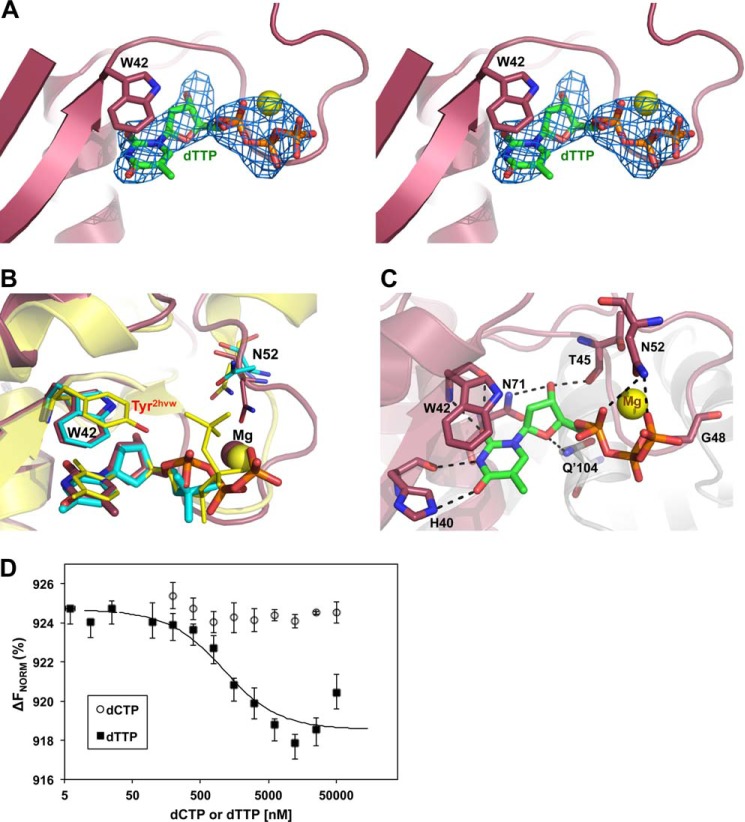
FIGURE 3.
dTTP bound at the allosteric binding site. A, cross-eyed stereo view of an Fo − Fc map (blue mesh) at 3 σ calculated with dTTP omitted from the S-TIM5-T structure. Trp42 is displayed as sticks, and the Mg2+ ion is a yellow sphere. B, structural alignment of the allosteric binding sites of S-TIM5-T (magenta) and 2HVW (yellow). Trp42 and dCMP from the S-TIM5-C structure are superimposed in cyan. The aromatic residue of the allosteric binding site and the bound nucleotide are represented as sticks. C, polar interactions made between dTTP (green) and the protein environment (magenta) are shown in black dashed lines. Interacting residues are labeled and represented with sticks, and the Mg2+ ion is a yellow sphere. D, MST measurements. S-TIM5-dCD binding affinities to dCTP and dTTP. Standard deviations were obtained from triplicate experiments. ΔFNorm, normalized fluorescence units calculated as percentage of bound and unbound substrate.

