FIGURE 2.
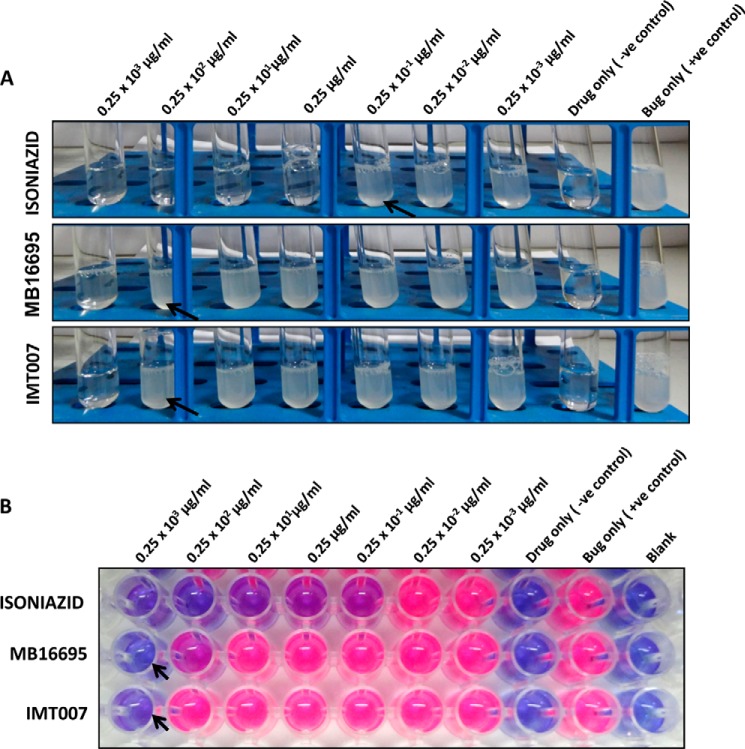
Growth inhibition of M. tuberculosis H37Rv. A, preliminary turbidity screen conducted to monitor inhibition on the growth of M. tuberculosis H37Rv upon treatment with different concentrations of the 10 candidate drugs (listed in Tables 3 and 4). MB16695 and IMT007 showed no growth at all at a 250 μg/ml concentration. Standard INH also shows no growth pattern for tubes with concentrations of 0.25 μg/ml and above. The remaining drugs had no effect on the growth even at higher concentration of 250 μg/ml (arrowhead indicates the maximum concentration of the drugs with any growth observed as described in Table 4). B, a MABA assay was performed to monitor the metabolic activity of the growing bacteria. The growth of M. tuberculosis H37Rv was indicated by the reduction of the dye producing a pink color, which was visually seen, and a fluorescence reading was also acquired. The 96-well plate shows wells corresponding to 250 μg/ml MB16695 and IMT007 with no color change (remaining blue), whereas the remaining drugs had all of the wells turned into a pinkish color (arrowhead indicates the non-reduced form of the dye representing the growth inhibition).

