
Figure 2.
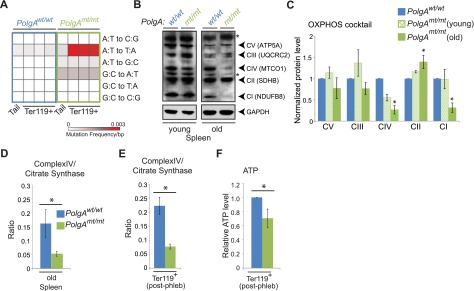
mtDNA mutation–associated decline in mitochondrial respiration in erythroid cells from mtDNA-mutator mice. (A) DNA isolated from tails (at weaning) and Ter119+ erythroid cells from bone marrow (total Ter119+) and spleens (Ter119+ populations A and B) of 8-month-old phlebotomized mtDNA-mutator mice and wild-type littermate controls was assayed via PCR with primers directed against a portion of mtDNA. Calculated mutation frequencies from a representative experiment (tail and Ter119+ populations from littermates) are shown in the heat map. (B-C) Representative immunoblots and graphs (mean ± SEM) showing age-dependent changes in steady-state levels of labile components of the mitochondrial electron transport complexes (CI-CV). n = 2 mice per genotype (young) or 3 mice per genotype (old). Asterisk in panel B denotes nonspecific band. (D) Total spleen from old animals was used for analysis of CS and CIV. Graph (mean ± standard deviation) shows ratio of CIV to CS activities. n = 2 mice per genotype. (E) Ter119+ erythroid cells were positively selected from spleens of phlebotomized mice by using magnetic beads and used for analysis of CS and CIV activities. Graph (mean ± SEM) shows ratio of CIV to CS activities. n = 4 mice per genotype. (F) Ter119+ erythroid cells were positively selected from bone marrow of phlebotomized mice by using magnetic beads and used for ATP analysis. Values were normalized to that of Ter119+ population “A” in wild-type mice for each experiment. n = 5 mice per genotype.