
Figure 5.
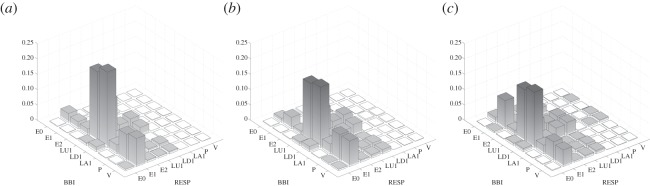
Three-dimensional plots of the HRJSD pattern family distribution density matrix Wf (8×8) for the threshold levels lBBI and lRESP equal to 25% of the standard deviation of the BBI and RESP time series for healthy subjects (a), healthy first-degree relatives (b) and schizophrenic patients (c). (BBI, beat-to-beat intervals; RESP, respiratory frequency.)