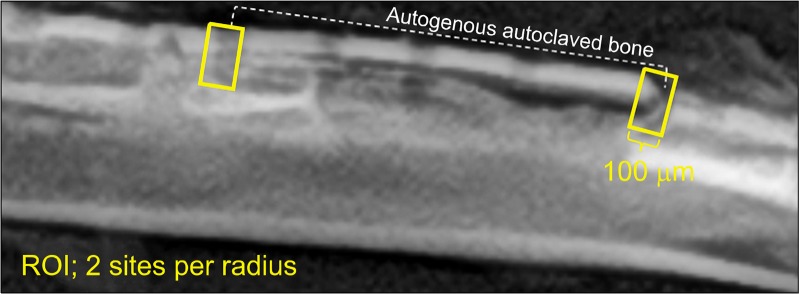
Fig. 2.

Schematic drawing of ROI. Quantitative analyses: BV/TV, TbTh, TbN, and TbSp, were measured using micro-computed tomography within this ROI at each proximal end of the autoclaved autogenous bone. ROI, region of interest; BV, bone volume; TV, total volume; Tb, trabecular; Th, thickness; N, number; Sp, separation.
