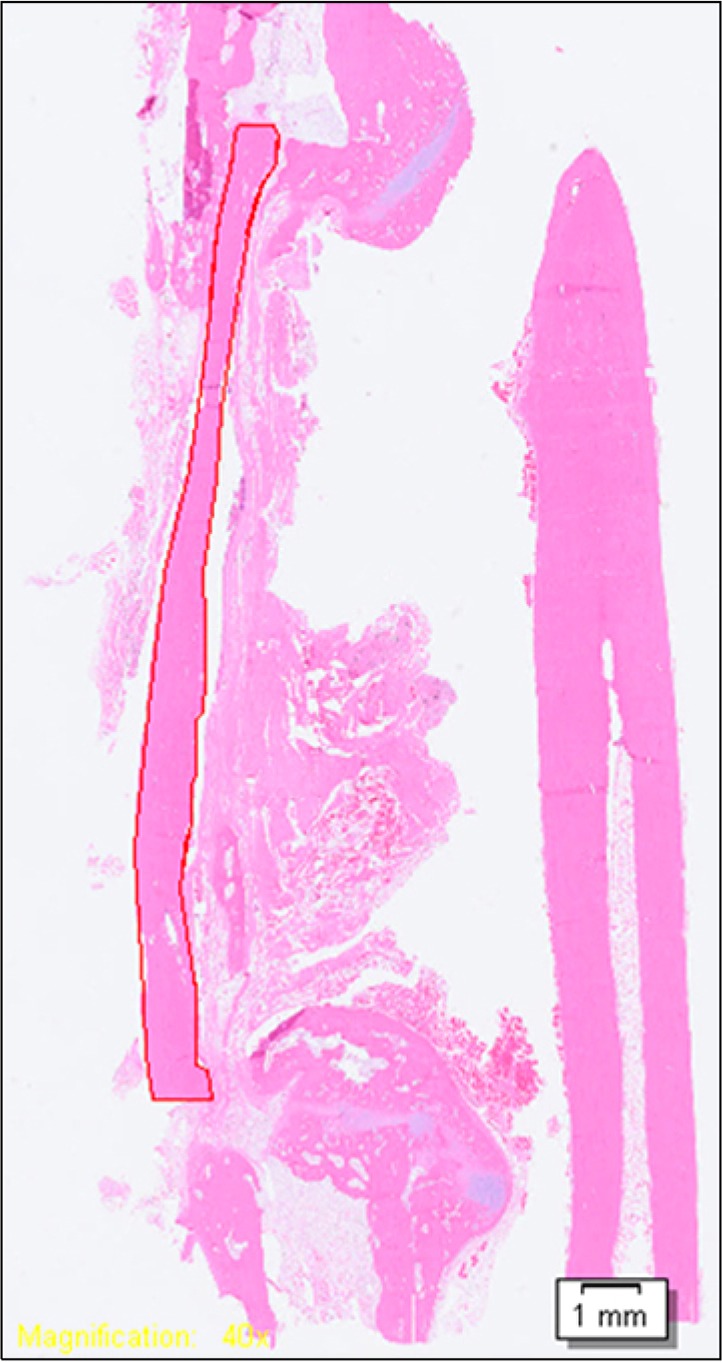
Fig. 3.

Method for calculating the degree of engraftment. Red line represents the autoclaved autogenous bone perimeter, within which we measured the proportion of perimeter showing osteoid, osteoblasts, and the reversal line at higher magnification (H&E, ×40).
