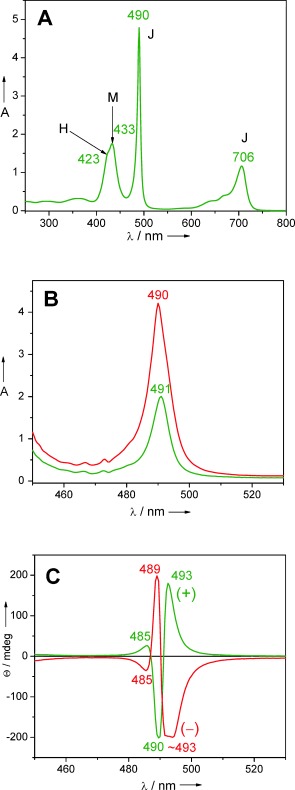
Figure 1.

A) Aggregation behaviour after injection of 300 μL of a solution 5.3 mg TPPS4⋅2 HCl dissolved in 1.0 mL deionized water (pH 7) into 10 mL aqueous HCl at pH 1. M denotes monomer maxima, J and H denote aggregate maxima. B,C) Absorption and ECD spectra, respectively, of samples prepared from similar aggregation experiments, ripened for 24 h. The rarely encountered negative exciton couplet (red trace) has the longest Cotton effect slightly truncated due to saturation of the detector. The different cuvette pathlengths (red trace—2 mm; green trace—1 mm) were chosen to obtain similarly intense Cotton effects and were not responsible for the mirror imaged traces.
