FIG 5 .

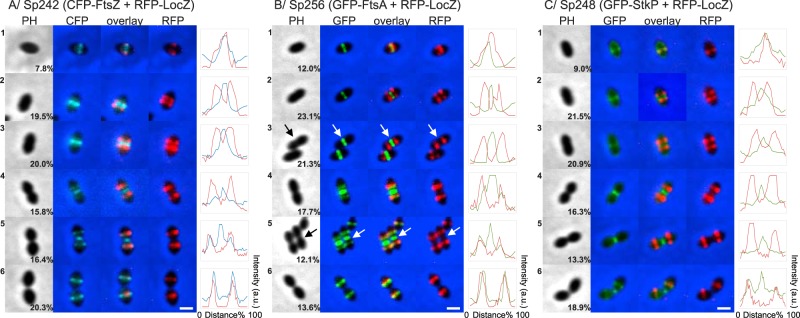
Colocalization of LocZ and FtsZ, FtsA, or StkP. Double-labeled strains, expressing RFP-LocZ at the native locus from its native promoter and CFP-FtsZ, GFP-FtsA, or GFP-StkP from the constitutive or PczcD promoter, analyzed by fluorescence microscopy. Cells representing the six different stages of S. pneumoniae cell division are shown. The percentages of cells in each division stage, over 359, 389, and 354 cells counted, respectively, are indicated in the PH panel. All cells at each stage showed the same localization profile as that of the representative cell shown in the respective figure. (A) Sp242 (rfp-locZ, pBCSMH036) expresses CFP-FtsZ under the control of the constitutive promoter on the plasmid. (B) Sp256 (rfp-locZ bgaA::PczcD-gfp-ftsA) expresses GFP-FtsA under the control of the PczcD inducible promoter. (C) Sp248 (rfp-locZ bgaA::PczcD-gfp-stkP) expresses GFP-StkP under the control of the PczcD inducible promoter. Phase contrast (PH), GFP signal (GFP), CFP signal (CFP), RFP signal (RFP), and corresponding overlays are shown. Bar, 1 µm. Fluorescence intensity profiles of CFP-FtsZ (blue), GFP-FtsA (green), or GFP-StkP (green) versus RFP-LocZ (red) in arbitrary units (a.u.) along the cell length are shown on the right. Arrows indicate the cell analyzed in pictures containing multiple cells.
