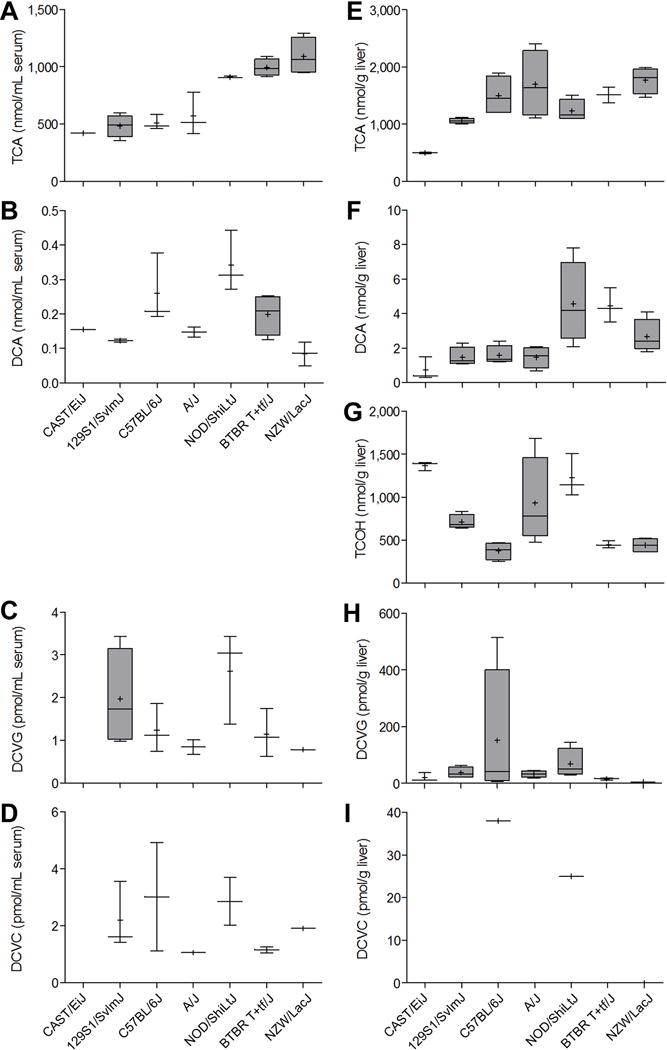
Figure 1. Inter-strain variability in TCE metabolism in the mouse in a sub-acute study.

Serum (A-D) and liver (E-I) levels of metabolites were assessed 2 h following the last of 5 daily doses (600 mg/kg) of TCE. Box and whisker plots are shown (+, mean; line, median; box, inter-quartile range; whiskers, min to max). When box is shown, 4 animals per group were available. Otherwise, there were 3 animals per group.
