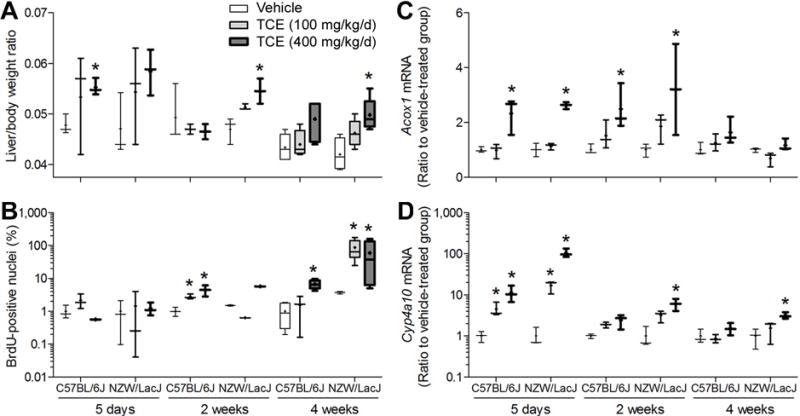
Figure 7. Differences in liver toxicity of TCE in C57BL/6J and NZW/LacJ mice in a sub-chronic study.

Liver to body weight ratios (A), percent BrDU-positive hepatocyte nuclei (B), and liver expression of peroxisome proliferation marker genes Acox1 (C) and Cyp4a10 (D) were evaluated in mice treated with TCE (100 or 400 mg/kg) for 1, 2 or 4 wks. Box and whiskers plots are shown (+, mean; line, median; box, inter-quartile range; whiskers, min to max). White, vehicle-treated groups; light-gray, 100 mg/kg/d groups; dark gray, 400 mg/kg/d groups. When box is shown, 4 animals per group were available. Otherwise, there were 3 animals per group. Asterisk (*) denotes a significant (p<0.05) difference as compared to vehicle-treated group (same strain and time point).
