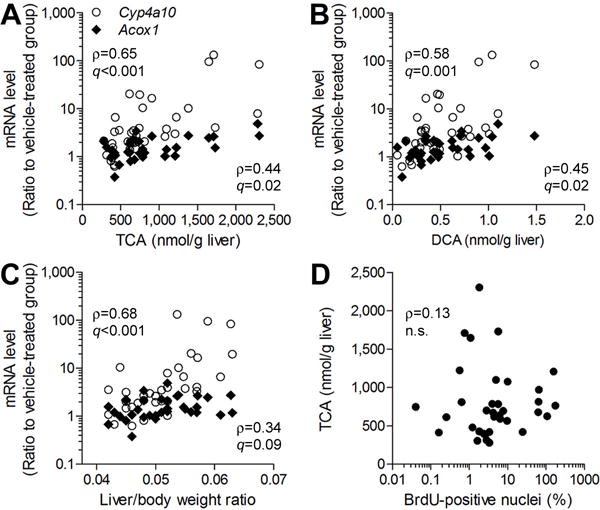
Figure 8. Correlation between TCE metabolites and liver toxicity phenotypes in C57BL/6J and NZW/LacJ mice in a sub-chronic study.

TCE-induced increase in Cyp4a10 and Acox1 expression in the mouse liver was significantly correlated with liver levels of TCA (A) and DCA (B), and liver to body weight ratio (C). (D) No correlation was observed between TCA concentration in the liver and hepatocellular proliferation. Each symbol represents an individual animal in the study. Spearman rank (ρ) correlations and false discovery rate-corrected significance values (q<0.1) are shown.
