
Figure 7. Correlation of DAB2 mRNA levels with miR-93 levels in lung cell lines.
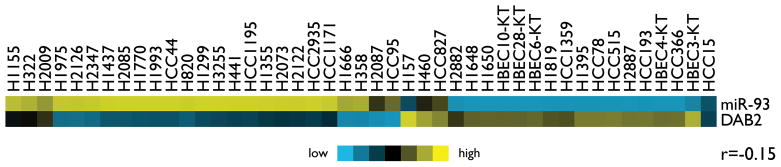
Heatmap presentation of the expression of miR-93 and DAB2 mRNA in 45 cell lines, with blue indicating relative under-expression and yellow indicating relative over-expression. The correlation between miR-93 and DAB2 mRNA levels was assessed by Pearson correlation.