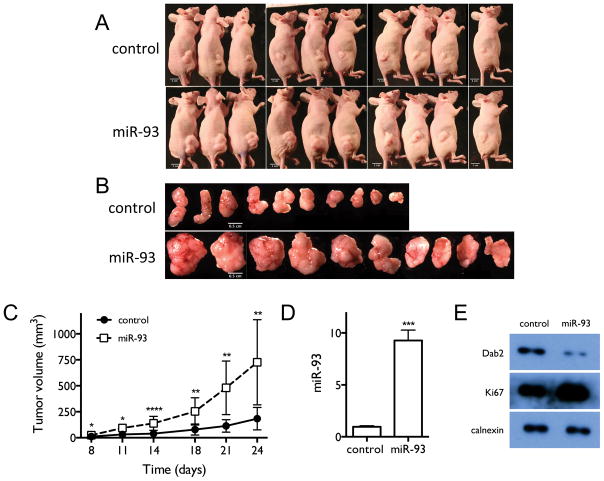
Figure 8. miR-93 over-expression promotes tumor growth in mouse tumor xenografts.
A, Mice injected with H1993 cells stably over-expressing miR-93 or control H1993 cells with stably integrated empty vector. Images were taken at the end point of the experiment. B, Tumors in each group. C, Time-dependent tumor growth curves of the different treatment groups. D, Tumor levels of miR-93, measured by qRT-PCR. E, Tumor levels of Dab2 and Ki67 proteins, measured by western blot. *, p < 0.05; **, p < 0.01; ***, p < 0.001; ****, p < 0.0001.

