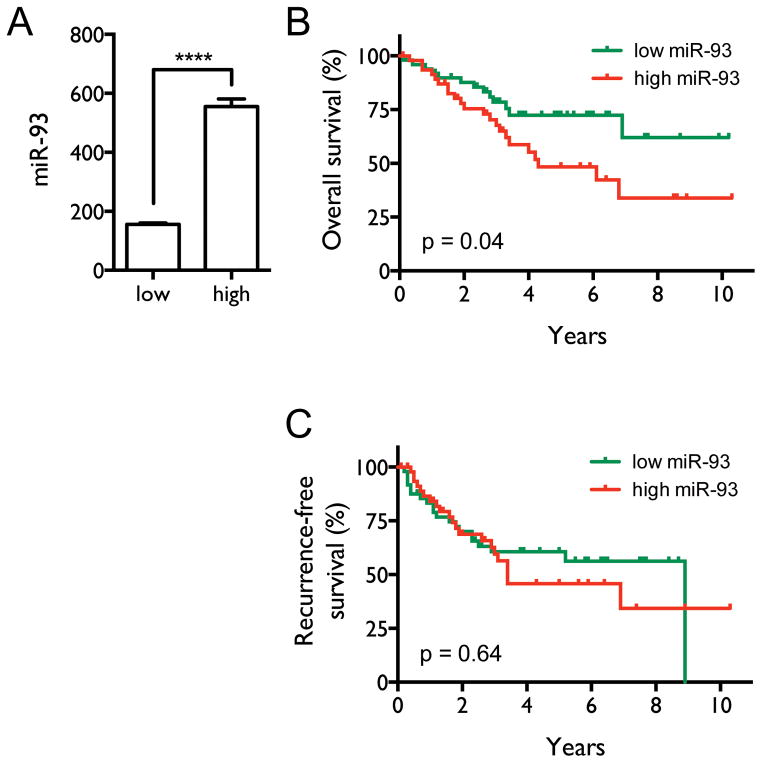
Figure 9. High levels of miR-93 correlate with poor patient survival.
A, Patients were stratified by miR-93 levels, with the top and bottom quintiles of the 245 NSCLC patients defining the high and low miR-93 expression groups (n=50 per group). The mean miR-93 levels are significantly different between the two groups, assessed by two-tailed t-test. ****, p < 0.0001. B, Overall survival curves for the two groups. Median overall survival times in the low (green) and high miR-93 (red) groups were > 10.2 y and 4.3 y, respectively, with a hazard ratio of 2.00 (95% CI 1.03–3.91), and p = 0.04. C, Recurrence-free survival curves for the two groups. Median recurrence-free survival times in the low and high miR-93 groups were 8.9 y and 3.4 y, respectively, with a hazard ratio of 1.16 (95% CI 0.62–2.15), and p = 0.64. Statistical significance was assessed by Mantel-Cox log-rank test.

