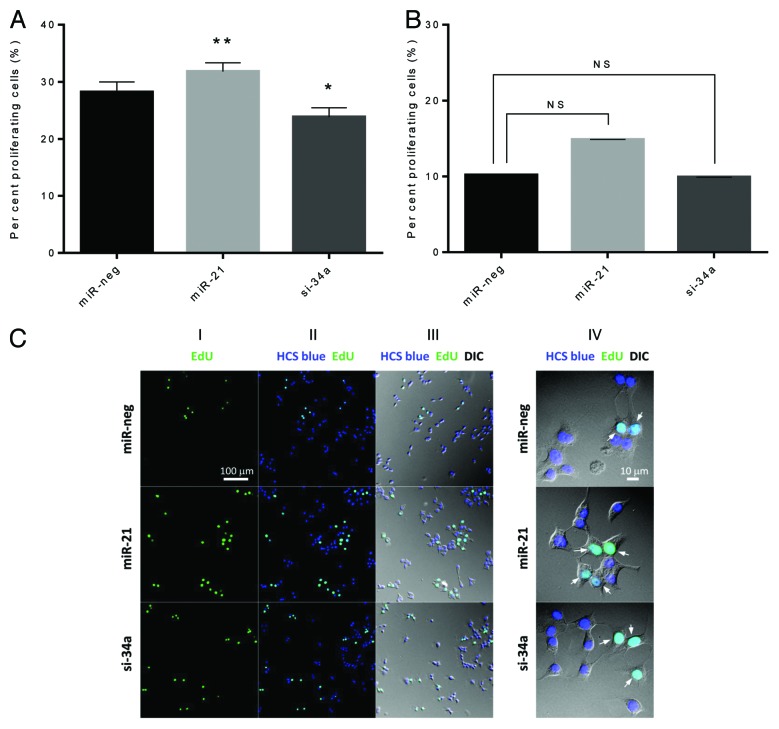
Figure 4. miR-21 overexpression and miR-34a knockdown affect β-cell proliferation. (A and B) Cells (25 000 cells) were left untreated (A) or were exposed to IL-1β and IFN-γ for 24 h (B). Nuclei were stained using EdU and HCS Blue, and fixed with mounting reagent. Nuclei were counted by 2 blinded observers as total number of cells (blue nuclei) and proliferating cells (green nuclei). The ratio of proliferating cells was calculated. Results of 4 independent experiments are shown as means + SEM. Statistical significance was determined using a 2-way paired t test. * P < 0.05 vs. miR-neg, ** P < 0.01 vs. miR-neg. (C) Representative photomicrographs of β-cell proliferation. Panel I shows proliferating cells identified by EdU staining, panel II shows a merge of total number of cells (blue nuclei) and proliferating cells (green nuclei), and panel III shows a merge between panel I and II and an image taken using digital interference contrast microscopy (DIC). Panel IV shows a close-up of panel III (arrows indicate proliferating cells).

An official website of the United States government
Here's how you know
Official websites use .gov
A
.gov website belongs to an official
government organization in the United States.
Secure .gov websites use HTTPS
A lock (
) or https:// means you've safely
connected to the .gov website. Share sensitive
information only on official, secure websites.
