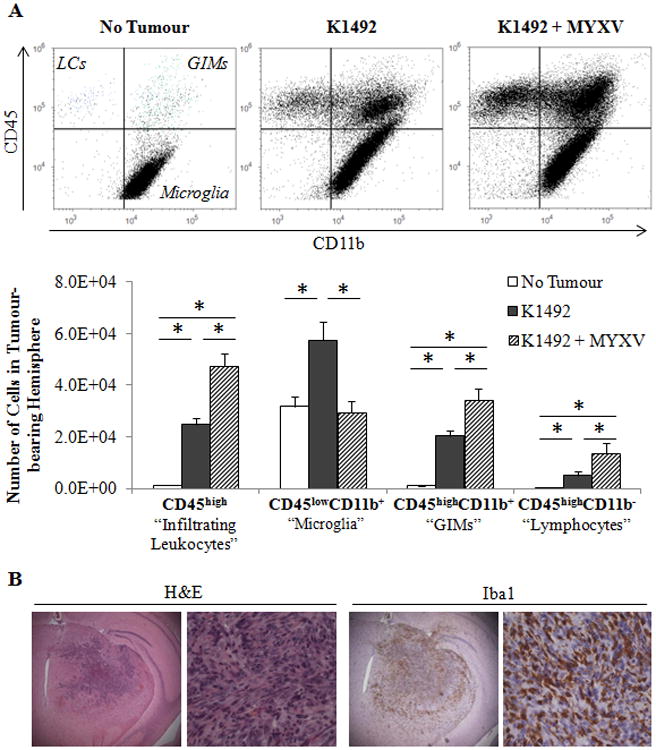
Figure 1. Immunophenotyping of the K1492 glioma microenvironment after Myxoma virus treatment.

C57Bl/6 mice were implanted with K1492 cells and analyzed by flow cytometry at 15 days-post implantation, 3 days post-treatment with Myxoma virus (5×10⁶ FFU vMyx-GFP; K1492-MYXV, n=10) or untreated (K1492, n=10). Non-tumour bearing mice were used as a control (No Tumour, n=6). Mice were assayed individually and data shown as a mean of all mice. A – Top: Representative scatter plots for CD45/CD11b gating for all experiments. LC – Lymphocytes; GIMs – Glioma infiltrating monocytes/macrophages. Bottom: Quantification of each cell type isolated from the tumour-bearing hemisphere. Error bars represent standard error, and asterisks indicate statistical difference (p<0.05). B - C57Bl/6 mice were implanted with K1492 cells and formalin-fixed paraffin sections were stained with H&E or the microglial/macrophage marker Iba1 14 days after implantation. (First row 25×; Second row 200×). Representative staining from 3 animals/group.
