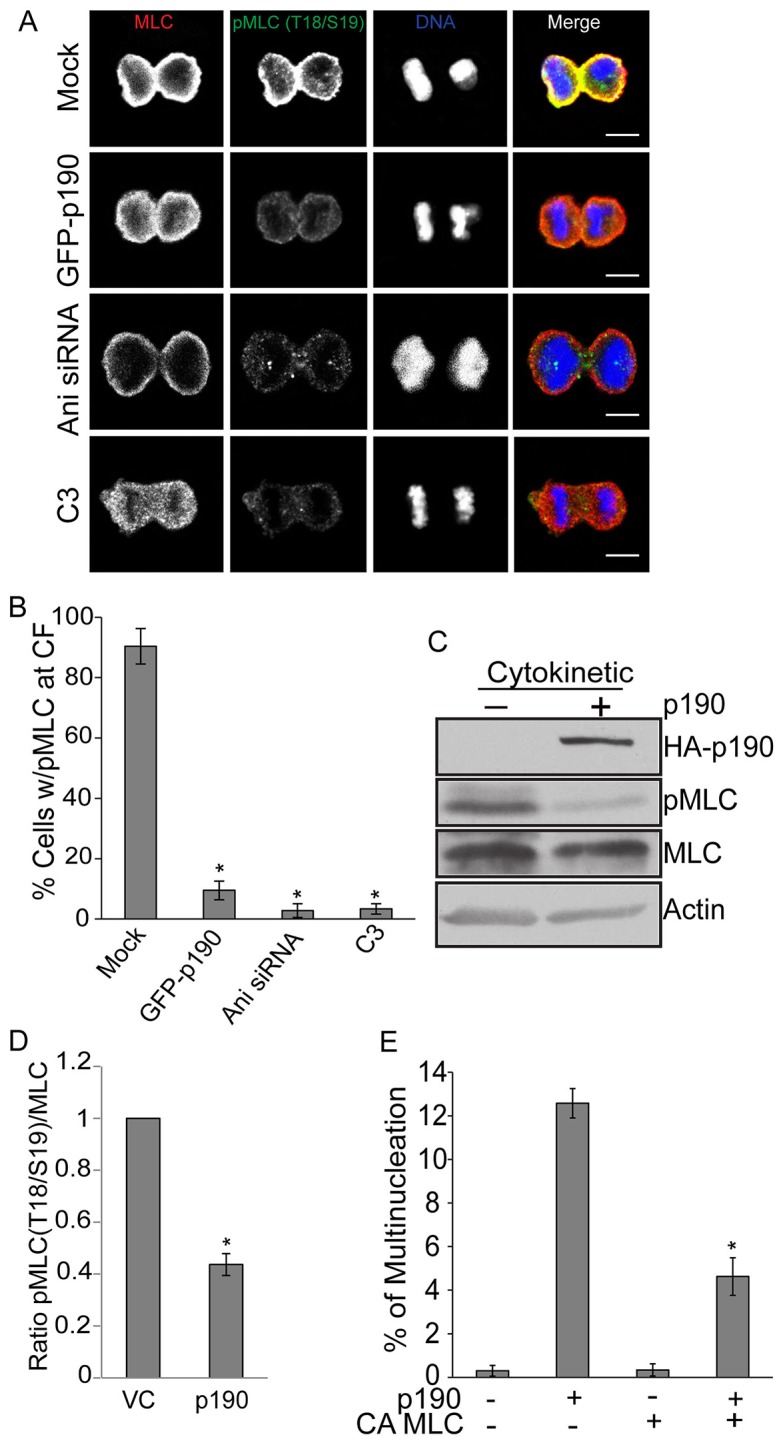
Fig. 3.

Overexpression of p190 decreases RhoA-GTP levels. (A) Confocal images of total MLC II and pMLC II in HeLa cells during cytokinesis. HeLa cells were mock-treated or transiently transfected with empty plasmid or p190 plasmid. Separate cultures were treated with anillin siRNA or C3 toxin. Cells were then fixed and stained for total MLC II (red), pThr18/Ser19 MLC II (green) and DNA (blue). Images shown are representative of n>30. Scale bars: 5 µm. (B) Quantification of the number of HeLa cells with enriched pMLC II at the cytokinetic furrow during cytokinesis. Results are expressed as the mean±s.e.m. percentage of total cells in cytokinesis or cytokinetic cells positive for GFP–p190 that exhibited localization of pMLC II at the cytokinetic furrow (CF). n>3, with >15 cells/experiment. *P<0.005 (Student's t-test) as compared to mock. (C) HeLa cells were either mock-treated (–) or transiently transfected with HA–p190 plasmid (+). Cells were synchronized by nocodazole block and release and the levels of total MLC II, pMLC II, and HA–p190 were assessed by western blot analysis. (D) Quantification of C. Overexpression of p190 decreases RhoA activity as measured by pMLC II. Levels were normalized to actin, and the ratio of pMLC II:total MLC II was then determined and normalized to the ratio in vector-transfected (VC) cells, which was set to 1. Results are expressed as the mean±s.e.m. fold ratio over that of VC cells, n>3. *P<0.05 as compared to VC. (E) Constitutively active (CA) MLC II rescues multinucleation induced by p190 overexpression. HeLa cells were mock-treated or transiently transfected with HA–p190 or CA MLC II plasmids singly or in combination, and scored for multinucleation. Results are expressed as the mean±s.e.m. percentage of total cells (Mock) or cells positive for HA–p190 and or CA MLC II that were multinucleate, n>3, with >90 cells/experiment. *P<0.005 as compared to mock.
