
Fig. 6.
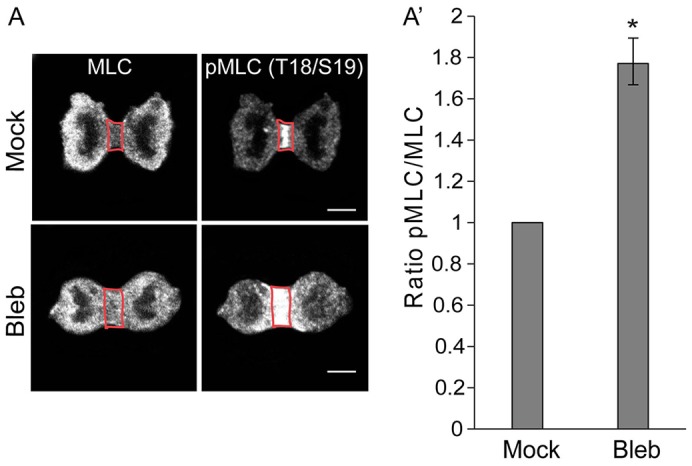
p190 and anillin associate during cytokinesis in a contractility-dependent manner to regulate MLC II activation. (A) Confocal images of total and pMLC II in HeLa cells during cytokinesis. HeLa cells were either mock-treated or treated with 50 µM blebbistatin for 40 minutes and stained for MLC or pMLC (Thr18/Ser19). The area outlined in red defines the cytokinetic furrow (region of interest, ROI), which was analyzed for pixel intensity. Images shown are representative of n>30. Scale bars: 5 µm. (A′) Quantification of specific MLC II activity. The ratio of pMLC II to MLC II intensities was calculated, and results are expressed as the mean±s.e.m. pixel intensity ratio, n>3, with >15 cells/experiment. *P<0.005 (Student's t-test) as compared to mock, which was set to 1.