
Fig. 1.
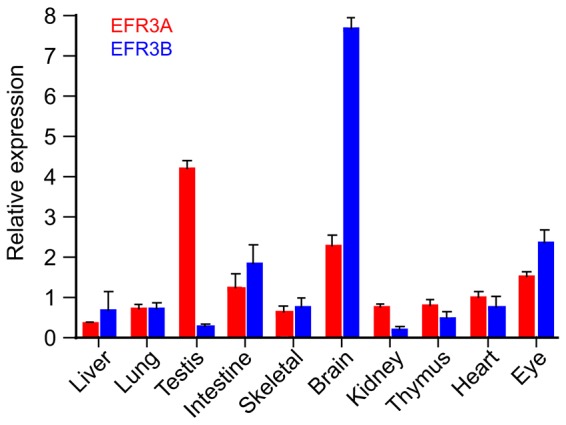
Relative expression of EFR3A and EFR3B mRNAs in various mouse tissues. Total RNA from various mouse tissues was isolated and cDNA synthesized as described in Materials and Methods. Real-time qPCR was performed using SYBR Green and primers specific for the respective mRNAs (see Materials and Methods). The signal was then normalized to that of 18S rRNA. Means+s.e.m. (n = 6) are shown from duplicate determinations of three independent mouse and tissue isolations. See the predominant expression of EFR3B in the brain and that of EFR3A in the testis.