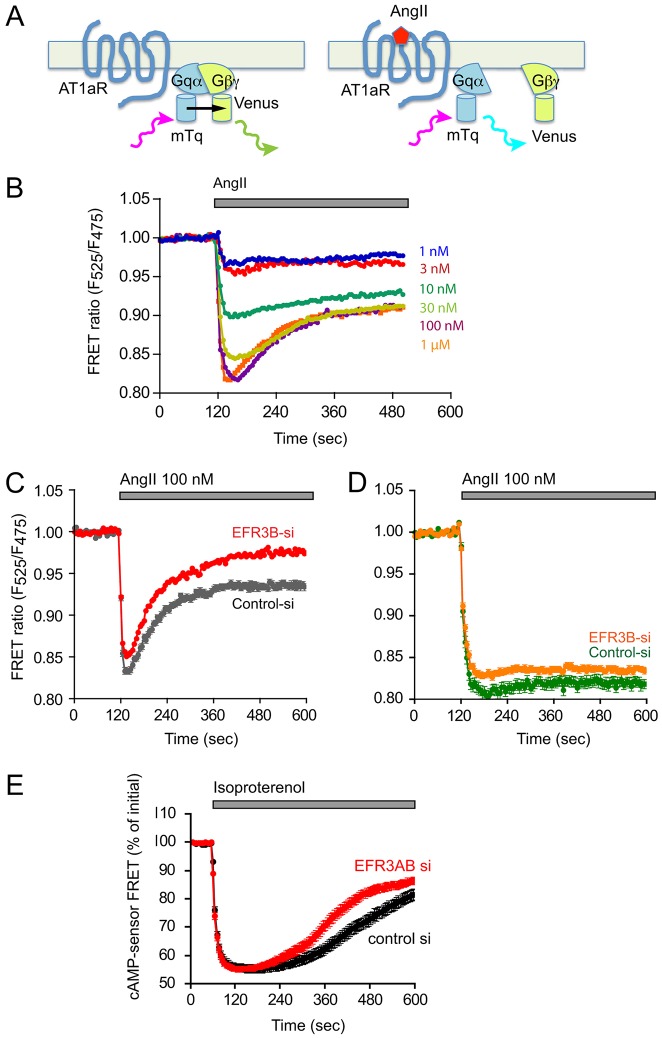
Fig. 7.
Effect of EFR3B knockdown on Gq activation kinetics in HEK293 cells expressing wild-type or tail-deleted AT1a receptor. (A) Schematic of the principles of monitoring Gq activation using FRET. Upon excitation, the mTq fluorescent protein engineered into the Gq α-subunit will transfer its energy to the mutated YFP Venus, which is attached to the γ-subunit of the βγ complex in the tightly associated heterotrimer. After activation of the AT1a receptor, the dissociation of the heterotrimer will result in a decrease in direct energy transfer, which can be detected as an increased emission from mTq and a decreased emission from Venus (see (Goedhart et al., 2011) for details). (B) FRET measurements in HEK293-AT1 cells expressing the wild-type AT1a receptors were stimulated with increasing concentrations of AngII. (C) HEK293 cells expressing the wild-type AT1a receptors were treated for 3 days either with control siRNA (grey trace) or with EFR3B siRNA (red trace). Means±s.e.m. are shown for 250 and 216 cells in control and EFR3B-depleted cells, respectively, that were acquired in three independent knockdown experiments (note that the error bars are too small to be visible in the red trace). (D) FRET experiments as described in B, except that HEK293 cells expressing the truncated AT1a receptors were used. Means±s.e.m. are shown for 53 and 91 cells in control and EFR3B-depleted cells, respectively, that were acquired in two independent knockdown experiments. (E) cAMP changes in HEK293-AT1 cells that had been stimulated with isoproterenol. Cells were treated with siRNA against EFR3A/B or control siRNA and then transfected with a FRET-based cAMP sensor (Klarenbeek and Jalink, 2014) to monitor changes in cAMP levels. A decreased FRET means an increase in cAMP. Means±s.e.m. are shown of 50-52 cells for EFR3AB or control siRNA treated cells. These were obtained in two separate knockdown experiments and using six independent dishes for each group. The difference between the two curves at time points later than at 240 sec is statistically significant (P<0.0001; using either non-paired t-test or the non-parametric Mann–Whitney test).

