Fig. 3.

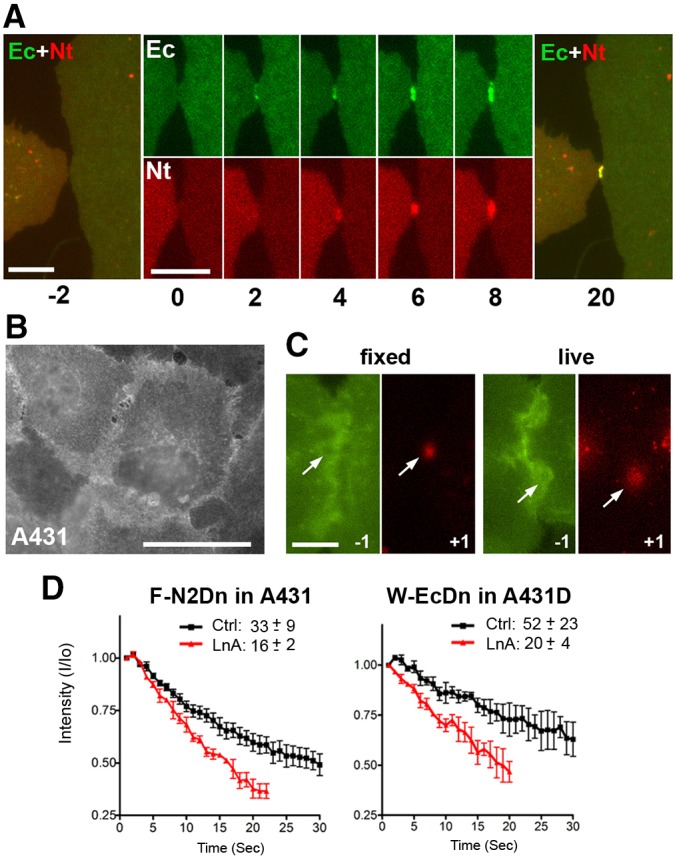
Kinetics of cadherin and nectin junction assembly. (A) A431 cells co-expressing EcadDn (Ec, green) and N2mCh (Nt, red) were imaged in 1-s intervals and with 1-s-long acquisition. Time (s) is shown below the frames. Time 0 is the moment when the cells touch one another. Note that cadherin clusters as fast as 2 s after time 0. Nectin clusters become visible only 2 s later. Merged images of the cells 2 s before (−2) and 20 s after (20) contact formation are also shown. Scale bars: 6 µm. (B) A431 cells expressing an adhesion-incompetent mutant of nectin-2, F136D-N2Dn. The mutant is randomly distributed along the cell surface. Scale bars: 30 µm. (C) Circular areas (diameter ∼2.5 µm) of F136D-N2Dn-expressing cells were photoconverted from green to red fluorescence. The green image taken 1 s before photoconvesion and the first red image taken 1 s after photoconversion are shown. The left pair of images was obtained from prefixed cells and the right pair from live cells. Note that the photoconverted red spot is much larger in live cells. Scale bar: 10 µm. (D) Graphs showing the change in intensity of the photoconverted red fluorescence over time (s) in the entire laser-irradiated area in the control conditions (Ctrl) and 10 min after Latrunculin A applications (LnA). The time needed for 50% decrease of the red fluorescence (t1/2) is shown for each case. The photoconversion experiments were repeated ten times with cells in each condition. Results are mean±s.d.
