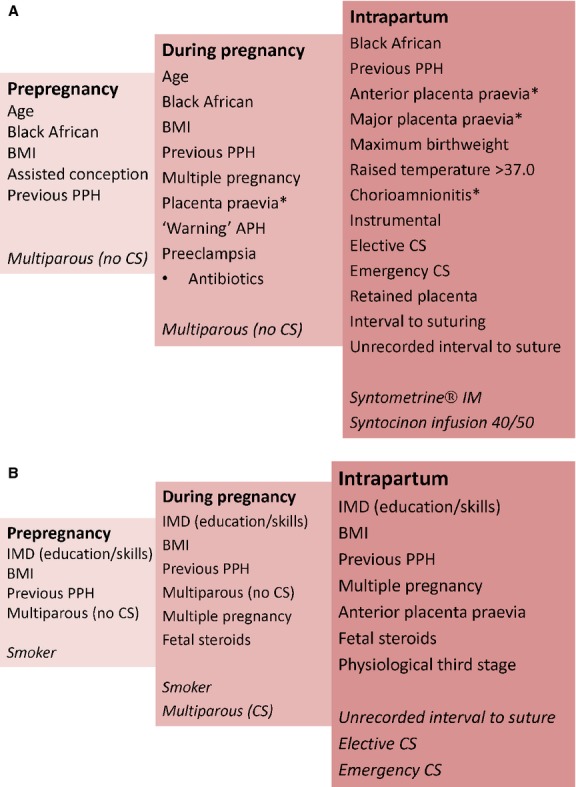
Figure 2.

Diagram of multiple logistic and chronological regression analysis showing (A) predictors of PPH ≥ 500 ml (protective factors in italics; asterisks indicate perfect predictors, i.e. all women had PPH) and (B) predictors of PPH ≥ 500 ml onto severe PPH ≥ 1500 ml (protective factors in italics).
