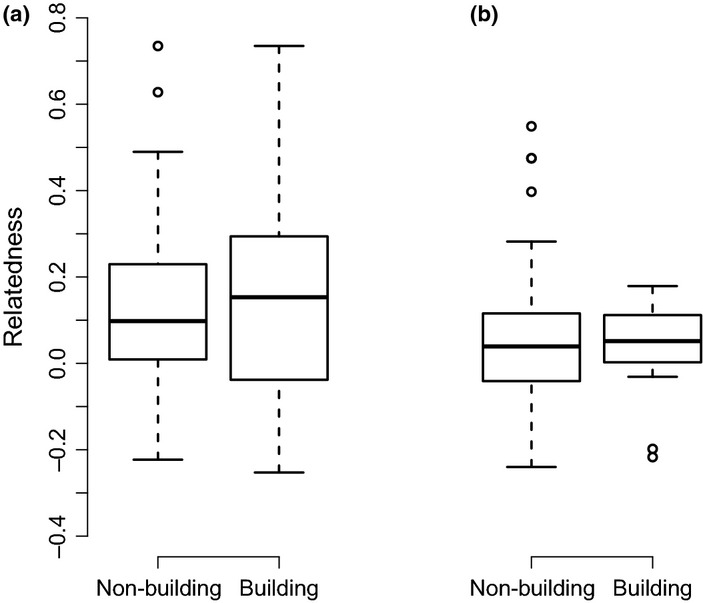
Figure 3.

Relatedness among 25% nearest neighbours of thatch-building vs. non-building sociable weavers. (a) within males (n = 262), and (b) within females (n = 138). Box plots indicate the median, the interquartile range, the maximum and minimum values excluding outliers, and outliers.
