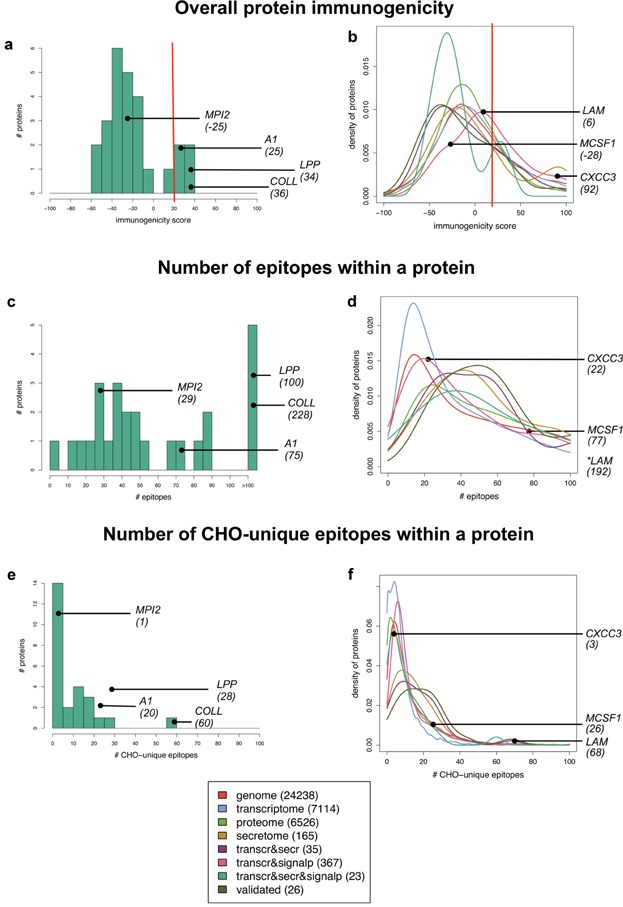
Figure 3.

Immunogenicity evaluations over different sets of CHOPs. The left panels (a, c, and e) characterize the validated CHOPs with histograms. Examples of validated CHOPs and their scores are shown: collagen (COLL), lysosomal protective protein (LPP), annexin A1 (A1), and metalloproteinase inhibitor 2 (MPI2). The right panels (b, d, and f) characterize various genome-filtered subsets with density estimates (smoothed histograms). Note that the y-axes of the density plots are differently scaled. Subsets: CHO genome, CHO transcriptome (transcr), CHO proteome, mouse secretome (secr), intersection of transcr with secr, intersection with predicted CHOPs containing predicted signal peptides (SignalP), intersection with secr and SignalP, and validated CHOPs (repeated from the left panels). Examples of potential immunogenic proteins and their scores (in parenthesis) are shown: C-X-C motif chemokine 3 (CXCC3), macrophage colony-stimulating factor 1 (MCSF1), and lysosomal alpha-mannosidase (LAM). a and b: Overall protein immunogenicity, truncated to show proteins scoring between −100 and 100 on the EpiMatrix immunogenicity scale. A red line indicates the level at which a protein is considered to be higher risk (EpiMatrix score of 20). c and d: Number of epitopes within a protein, truncated to 100. e and f: Number of epitopes within a protein that are not human-like, according to cross-reactivity analysis using JanusMatrix, truncated to 100.
