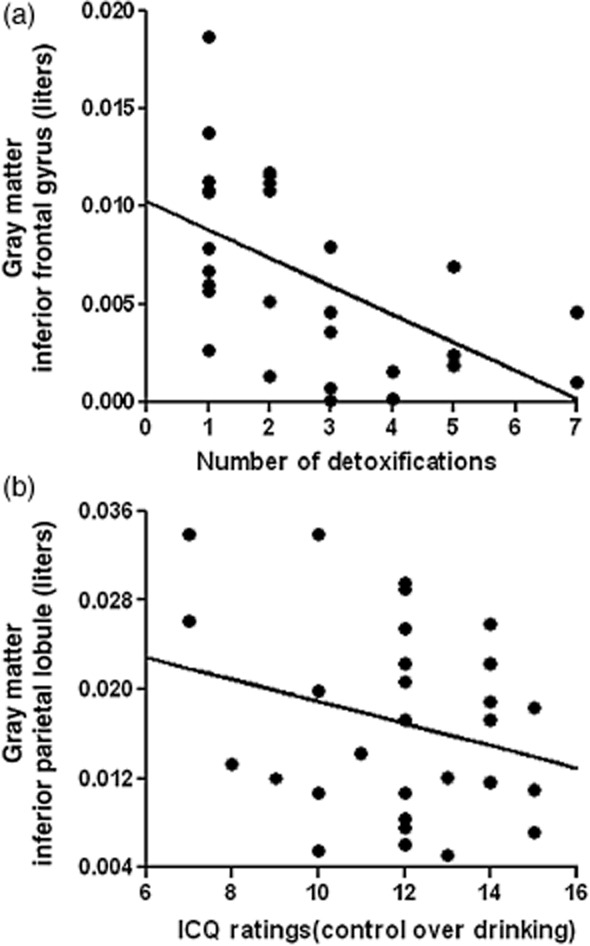
Figure 4.

Correlations depict the negative relationships between gray matter volumes in inferior frontal gyrus (raw data) and number of detoxifications (a; r = −0.47, P = 0.017) as well as between gray matter volumes in inferior parietal lobule (raw data) and ratings of inability to control drinking (b; r = −0.42, P = 0.030) in the patient group
