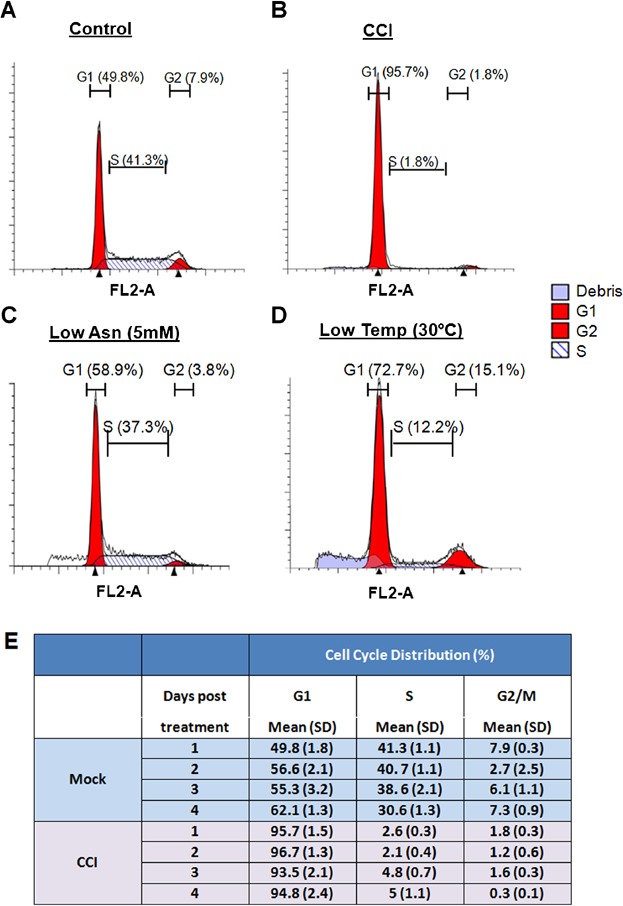
Figure 3.

Cell cycle profile of CHO recombinant cells treated with CDK4/6 inhibitor. A recombinant CHO cell line was cultured in different growth control conditions. Cells were cultured in batch medium with mock (A), with 10 µM of CCI for 24 h at 36°C (B), low Asn (C), or reducing culture temperature (D) conditions. Cell cycle profiles were obtained by PI staining followed by flow cytometry analysis. The red fill in the first and second peaks indicate the range estimate of the size of the G1 and G2 peaks, respectively. The black area indicates S-Phase estimate. (E) The cell cycle distribution of mAb-expressing cell line with or/without CCI treatment. Data represent the mean ± SD of two independent replicate samples.
